. 2012 Sep;13(9):888-99.
doi: 10.1038/ni.2370. Epub 2012 Jul 15.

Deciphering the transcriptional network of the dendritic cell lineage

Collaborators, Affiliations

Deciphering the transcriptional network of the dendritic cell lineage

Jennifer C Miller et al. Nat Immunol. 2012 Sep.

Abstract

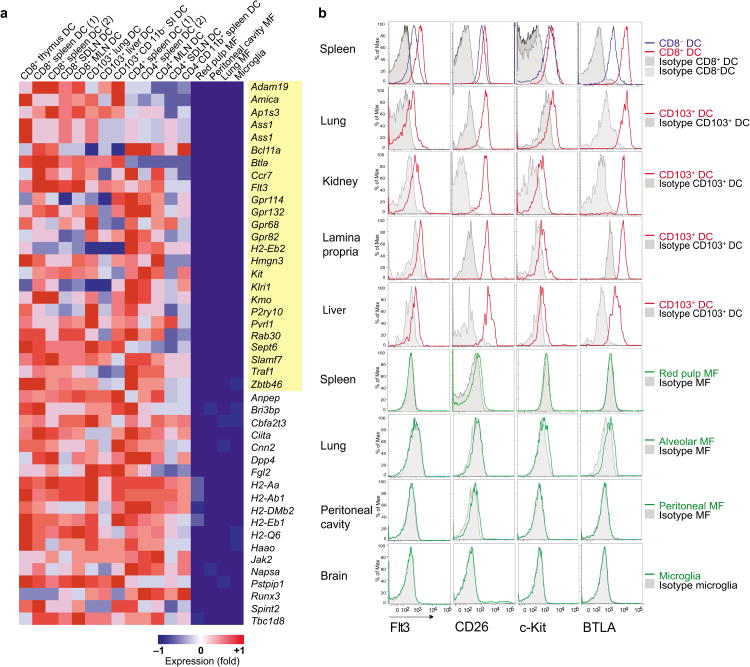
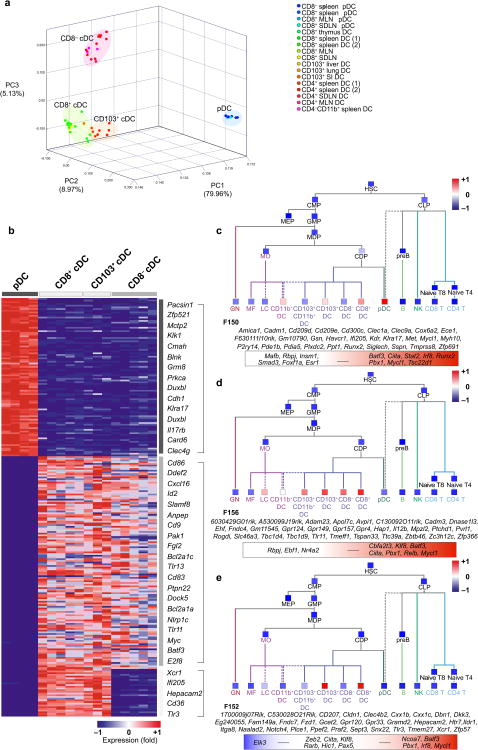
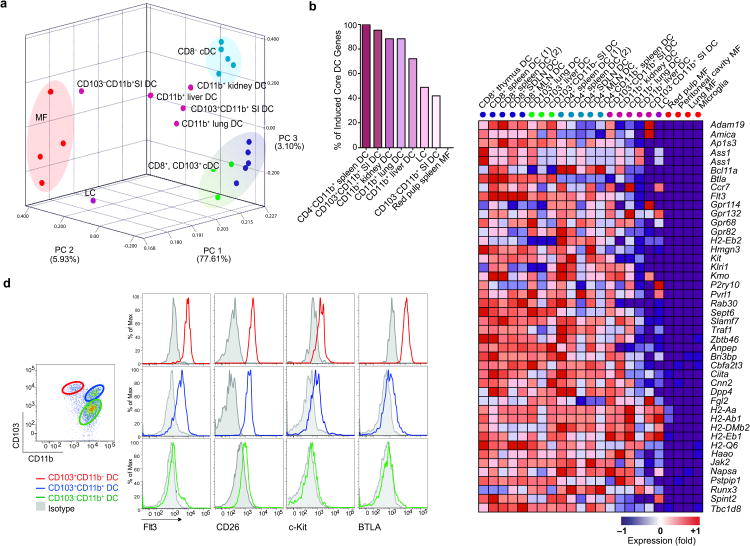
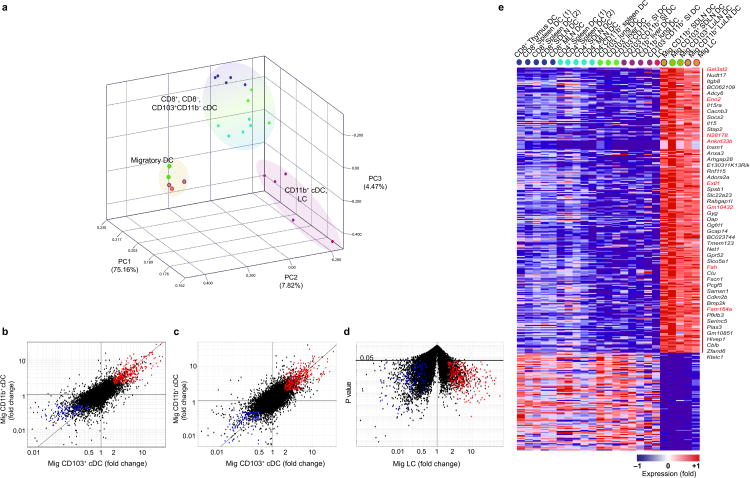
Although much progress has been made in the understanding of the ontogeny and function of dendritic cells (DCs), the transcriptional regulation of the lineage commitment and functional specialization of DCs in vivo remains poorly understood. We made a comprehensive comparative analysis of CD8(+), CD103(+), CD11b(+) and plasmacytoid DC subsets, as well as macrophage DC precursors and common DC precursors, across the entire immune system. Here we characterized candidate transcriptional activators involved in the commitment of myeloid progenitor cells to the DC lineage and predicted regulators of DC functional diversity in tissues. We identified a molecular signature that distinguished tissue DCs from macrophages. We also identified a transcriptional program expressed specifically during the steady-state migration of tissue DCs to the draining lymph nodes that may control tolerance to self tissue antigens.


Figures

Figure 1
Figure 1
Transcription factor expression along the DC lineage. (a) Graphs show the expression kinetics of transcriptional regulators up-regulated by 1.5 fold at the MDP level (i) and up-regulated (FC≥1.5) or down-regulated (FC≤ 0.67) at the CDP level (ii) in comparison to its precursor, downstream progeny or nearest neighbor. These regulators were clustered by common patterns of gene expression across the GMP, MDP, CDP, and monocyte families using the Express Cluster program. (b) Heatmap representation of Fig. 1a and transcripts up-regulated by at least 1.5 fold at each cellular checkpoint in comparison to their nearest developmental neighbor (cDC versus pDC and CD8 cDC versus CD8+ cDC) (Fig. S2). Genes are log-transformed, normalized, and centered. Populations and genes were clustered using pairwise centroid linkage with Pearson correlation. Red represents high relative expression, while blue represents low relative expression. *Replicates n ≥3 unless listed otherwise in Table 1.
Figure 2
Figure 2
Identification of gene uniquely expressed or up-regulated in cDC in comparison to MF. (a) Heat map exhibits transcripts significantly up-regulated (Student's t-test FDR ≤ 0.05; FC≥ 2) in lymphoid tissue cDC and non-lymphoid tissue CD103+ cDC compared to four prototypical MF populations. Transcripts expressed in cDC and absent in MF according to the QC95 value are highlighted in yellow and form the core cDC signature. Red represents high relative expression, while blue represents low relative expression. Values are listed in Tables 2 and 3. (b) Spleen, lung, kidney, lamina propria, liver, peritoneal cavity, and brain single cell suspensions were analyzed by flow cytometry. Histograms show the expression of Flt3, CD26, c0Kit, and BTLA in gated spleen CD8+, spleen CD8, tissue CD103+ cDC (red/blue lines), and tissue MF (green lines) populations relative to isotype control (gray lines). Data shown are representative of three different experiments. MLN: mesenteric LN; SDLN: skin draining LN; SI: small intestine. **Replicates n ≥3 unless listed otherwise in Table 1.
Figure 3
Figure 3
Unique gene signatures characterize distinct tissue DC clusters. (a) PCA of the top 15% most variable genes across pDC, CD8+ cDC, CD8 cDC and CD103+ cDC transcripts. Replicates are shown. (b) Heat map exhibits transcripts significantly (t-test FDR ≤ 0.05) up-regulated by at least two-fold and not expressed in the exclusion population according to the QC95 value in pDC vs cDC, cDC vs pDC, and CD8+/CD103+ cDC vs pDC/CD8 cDC. Representative genes are listed on the right. Full list is provided in Table S1. Red represents high relative expression, while blue represents low relative expression. (ce) ImmGen fine modules consisting of highly co-expressed transcripts and Ontogenet predicted regulators were extracted from the expression dataset representing all hematopoietic cells. Projection of (c) Module F150, (d) Module F156, and (e) Module F152 across the immgen data and mean expression of each module is shown (red colored squares represents high expression, while blue represent low relative expression). The genes expressed in each module are listed in italics below and predicted regulators are displayed in the color box. Red represents predicted activators, while blue represents predicted repressors. MLN: mesenteric LN; SDLN: skin draining LN; SI: small intestine. *Replicates n ≥3 unless listed otherwise in Table 1.
Figure 4
Figure 4
Non-lymphoid tissue CD11b+ cDC are heterogeneous. (a) PCA of the top 15% most variable transcripts expressed by lymphoid tissue CD8+ cDC, CD8 cDC, non-lymphoid tissue CD103+ cDC, non-lymphoid tissue CD11b+ cDC, epidermal LC and MF. Population means are shown. Population color labels displayed next to heatmap column labels of Fig 4c. (b) Graph show percentages of core cDC transcripts (identified in Fig. 2) that are up-regulated (FC≥2) in CD11b+ cDC subsets and red pulp MF. (c) Heat map indicates the relative expression of cDC and MF transcripts in each cDC population. Red represents high relative expression, while blue represents low relative expression. (d) Small intestine single cell suspensions were analyzed by flow cytometry for core cDC genes. Dot plot shows the expression of CD103 and CD11b on DAPICD45+CD11c+MHCII+ lamina propria cDC. Histograms show the expression of Flt3, CD26, c-Kit, and BTLA among CD103+CD11b cells, CD103+CD11b+ F4/80 cells and CD103+CD11b+ F4/80+ cells. Data shown are representative of three different experiments. MLN: mesenteric LN; SDLN: skin draining LN; SI: small intestine. LC: Langerhans cells.. *Replicates n ≥3 unless listed otherwise in Table 1.
Figure 5
Figure 5
Tissue migratory cDC up-regulate a unique gene signature regardless of tissue or cellular origin. (a) PCA of top 15% most variable transcripts expressed by lymphoid tissue resident CD8+ cDC and CD8 cDC, non-lymphoid tissue CD103+ cDC, non-lymphoid tissue CD11b+ cDC, epidermal Langerhans cells (LC), migratory (Mig) LC isolated from the skin draining LN, and migratory CD103+ and CD11b+ cDC isolated from skin-draining and lung-draining LN. Population means are shown. Fold change-fold change comparison of gene expression between (b) migratory CD103+ cDC and CD11b+ cDC and non-lymphoid tissue resident CD103+ and CD11b+ cDC, (c) migratory CD103+ cDC and CD11b+ cDC compared to lymphoid tissue resident CD8+ cDC and CD8 cDC, and (d) migratory LC versus epidermal LC. Red highlights transcripts significantly (FC≥2; t-test p≤ 0.05) increased by at least two–fold, whereas blue highlights those significantly decreased (FC≤ 0.5; t-test p≤ 0.05) in all population comparisons. (e) Heat map representation of the transcripts in fold-change fold-change plots from (b-d). Genes listed to the right are up-regulated by at least five-fold. Transcripts not expressed in steady state tissue cDC according to the QC95 value in migratory DC vs resident cDC are highlighted in red. Genes in heatmap are listed in Table S2. In heatmap, red represents high while blue represents low relative expression LuLN: lung draining LN; SDLN: skin draining LN; SI: small intestine, LC: Langerhans Cell. *Replicates n ≥3 unless listed otherwise in Table 1.
Figure 6
Figure 6
Tissue migratory cDC express immune dampening genes in the steady state. Bar graphs show fold changes of (a) immunomodulatory and Cd40 transcripts, (b) inflammatory transcripts in purified lung resident CD103+ cDC (gray), Poly: I:C treated lung CD103+ cDC (white), LN tissue resident CD8+ cDC (black) and lung migratory (Mig) CD103+ cDC (red) over the minimum value of the four compared populations. (c) LN single cell suspensions were analyzed by flow cytometry. Histograms show the expression of CD200, FAS, CD40, and PD-L1 in gated DAPICD45+CD11chiMHCIIInt resident cDC (blue) and DAPICD45+CD11cintMHCIIhi migratory cDC (pink) compared to isotype controls (gray). (d) LN resident cDC (left panels) and migratory cDC (right panels) were sorted, cytospun, and stained with secondary mAb alone (top panels) or anti-Pias-3 mAb (bottom panels). Magnification (63×). LuLN: lung draining LN; SDLN: skin draining LN; SI: small intestine, LC: Langerhans Cell. Data shown are representative of three different experiments. *Replicate n ≥3 in graphs unless listed otherwise in Table 1.

Comment in

References

    1. Banchereau J, Steinman RM. Dendritic cells and the control of immunity. Nature. 1998;392:245–252. - PubMed
    1. Steinman RM, Banchereau J. Taking dendritic cells into medicine. Nature. 2007;449:419–426. - PubMed
    1. Steinman RM, Hawiger D, Nussenzweig MC. Tolerogenic dendritic cells. Annu Rev Immunol. 2003;21:685–711. - PubMed
    1. Guermonprez P, Valladeau J, Zitvogel L, Thery C, Amigorena S. Antigen presentation and T cell stimulation by dendritic cells. Annu Rev Immunol. 2002;20:621–667. - PubMed
    1. Trombetta ES, Mellman I. Cell biology of antigen processing in vitro and in vivo. Annu Rev Immunol. 2005;23:975–1028. - PubMed

Publication types

Associated data