. 2012 Sep 14;287(38):32195-205.
doi: 10.1074/jbc.M112.391094. Epub 2012 Jul 13.

S-glutathionylation of the Na,K-ATPase catalytic α subunit is a determinant of the enzyme redox sensitivity

Affiliations

S-glutathionylation of the Na,K-ATPase catalytic α subunit is a determinant of the enzyme redox sensitivity

Irina Yu Petrushanko et al. J Biol Chem. .

Abstract

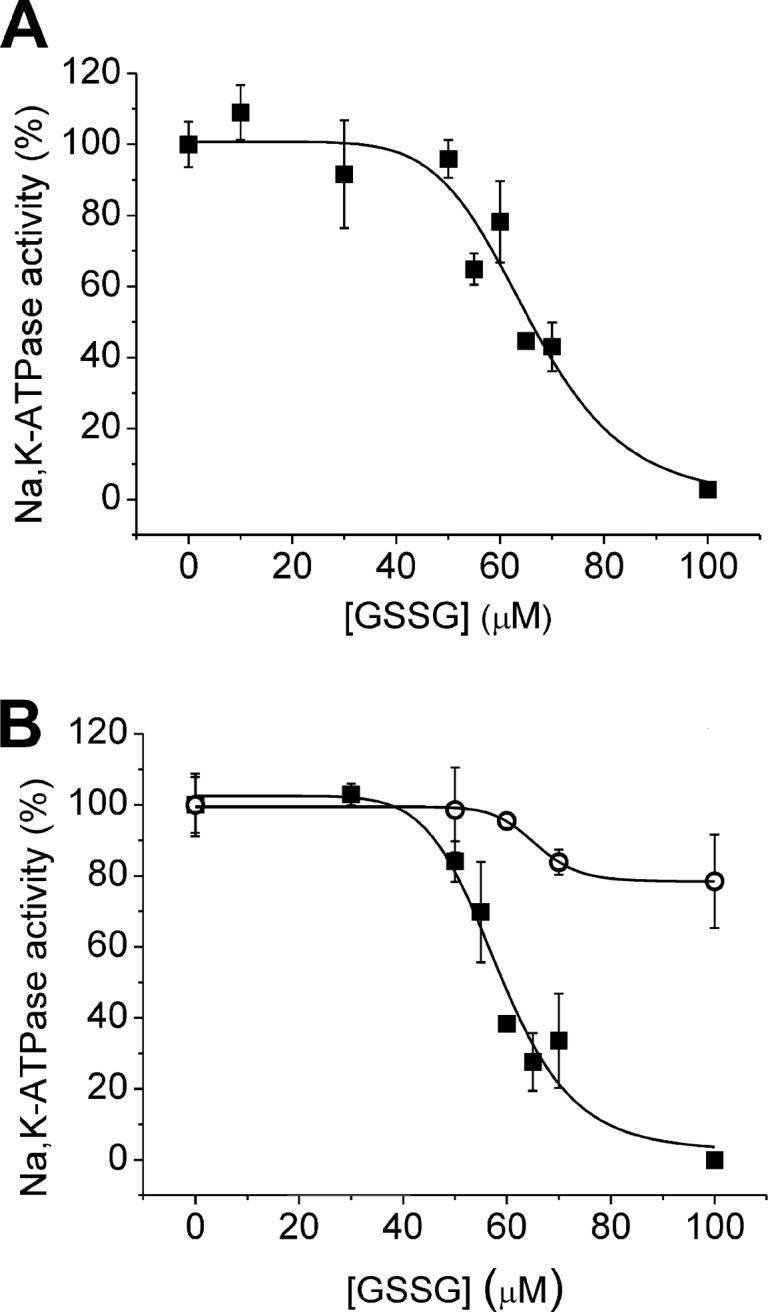
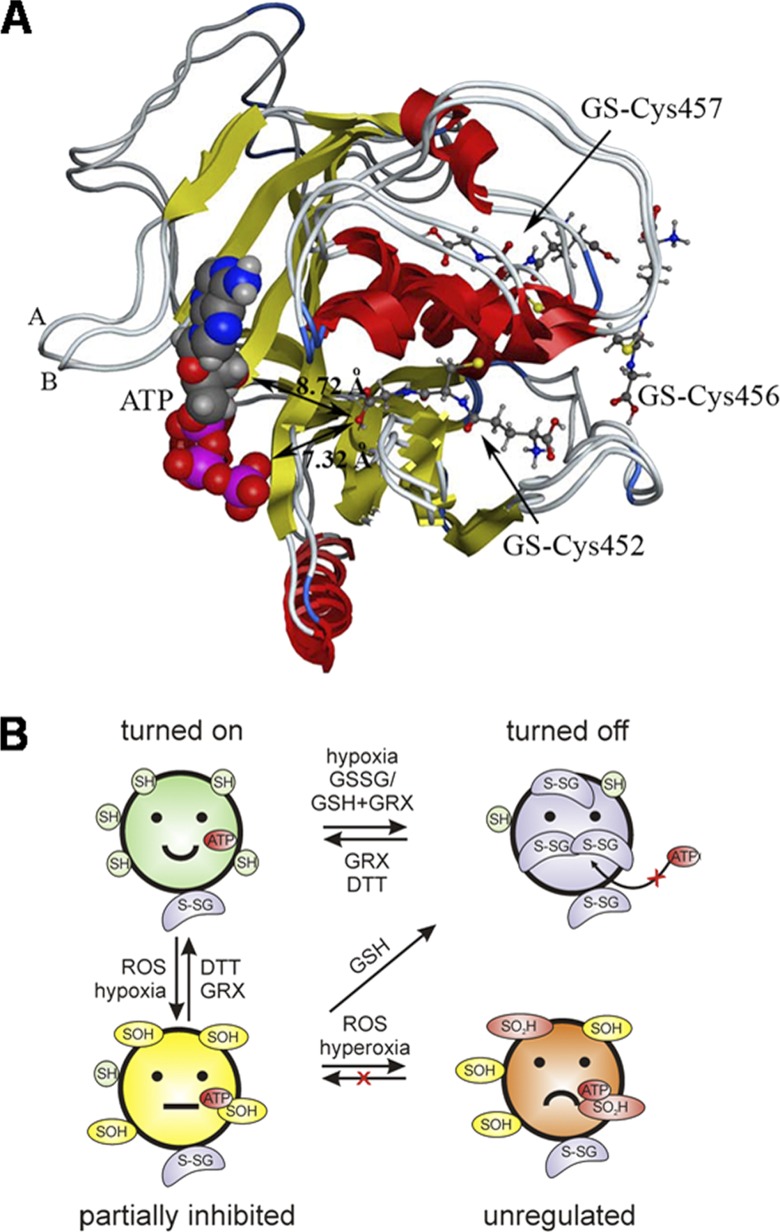
Na,K-ATPase is highly sensitive to changes in the redox state, and yet the mechanisms of its redox sensitivity remain unclear. We have explored the possible involvement of S-glutathionylation of the catalytic α subunit in redox-induced responses. For the first time, the presence of S-glutathionylated cysteine residues was shown in the α subunit in duck salt glands, rabbit kidneys, and rat myocardium. Exposure of the Na,K-ATPase to oxidized glutathione (GSSG) resulted in an increase in the number of S-glutathionylated cysteine residues. Increase in S-glutathionylation was associated with dose- and time-dependent suppression of the enzyme function up to its complete inhibition. The enzyme inhibition concurred with S-glutathionylation of the Cys-454, -458, -459, and -244. Upon binding of glutathione to these cysteines, the enzyme was unable to interact with adenine nucleotides. Inhibition of the Na,K-ATPase by GSSG did not occur in the presence of ATP at concentrations above 0.5 mm. Deglutathionylation of the α subunit catalyzed by glutaredoxin or dithiothreitol resulted in restoration of the Na,K-ATPase activity. Oxidation of regulatory cysteines made them inaccessible for glutathionylation but had no profound effect on the enzyme activity. Regulatory S-glutathionylation of the α subunit was induced in rat myocardium in response to hypoxia and was associated with oxidative stress and ATP depletion. S-Glutathionylation was followed by suppression of the Na,K-ATPase activity. The rat α2 isoform was more sensitive to GSSG than the α1 isoform. Our findings imply that regulatory S-glutathionylation of the catalytic subunit plays a key role in the redox-induced regulation of Na,K-ATPase activity.


Figures

FIGURE 1.
FIGURE 1.
S-Glutathionylation of the α and β subunits of Na,K-ATPase. Basal S-glutathionylation and S-glutathionylation after 1 h of incubation with 1 mm GSSG for α1 (A) and β1 (B) subunits of the duck Na,K-ATPase. Bars represent the changes in the S-glutathionylated (GSS-α1/β) form of the protein normalized by its total amount. n = 3, mean ± S.D. Presented above are the original immunoblotting readouts. Asterisk indicates significant differences (p = 0.014) relative to control as determined by the two-tailed t test. C, changes in S-glutathionylation of the α1 subunit isolated from rabbit kidneys in the absence (lanes 1 and 3) or in the presence (lanes 2 and 4) of 100 μm dithiothreitol and thereafter exposed to 1 mm GSSG at 25 °C for 25 min (lanes 3 and 4). D, S-glutathionylation of the α1 subunit in rat hearts perfused with normoxic (Norm, n = 3) or hypoxic (Hyp, n = 5) blood for 1 h. Bars represent the S-glutathionylated form of the protein (GSS-α1) normalized to total amount of the α1 protein (mean ± S.D.). Asterisk indicates significant differences (p = 0.0124) relative to the normoxic heart sample as determined by one-way analysis of variance.
FIGURE 2.
FIGURE 2.
Kinetics of GSSG-induced inhibition of rabbit kidney Na,K-ATPase. A, changes in the activity of the Na,K-ATPase during the incubation in the absence (filled squares) or presence of 25 (open diamonds), 71.5 (open triangles), or 143 μm (open circles) GSSG. Data are represented as the mean of three experiments ± S.D. Errors are less than 2 (not shown). B, logarithm of the relative Na,K-ATPase activity At/A0 was plotted against the time (t) of incubation with 143 μm GSSG. A0 denotes the activity of Na,K-ATPase without GSSG, and At denotes the activity at time (t) of incubation with GSSG. The inhibition constants (k) for the fast and slow phases of the reaction were obtained from the slope of the linear part of the curve by dividing it by the GSSG concentration in the medium.
FIGURE 3.
FIGURE 3.
Dose response of the inhibitory effect of GSSG on the purified Na,K-ATPase preparations. A, inhibition of the Na,K-ATPase isolated from rabbit kidneys by GSSG as a function of GSSG concentration. The enzyme activity was assessed after incubation with GSSG (25 min, 25 °C) and normalized to activity of the nontreated enzyme. The apparent IC50, obtained by fitting the data using the logistic sigmoid function, was 66 ± 3 μm. B, inhibition of the Na,K-ATPase isolated from duck salt glands by GSSG as a function of GSSG concentration (filled squares), as described above. The effect of exposure to air (4 h, 4 °C) prior to treatment with GSSG was also determined (open circle). The apparent IC50 for the inhibition with GSSG of the duck enzyme before exposure to air was 59 ± 2 μm. Data are represented as the mean of three experiments ± S.D.
FIGURE 4.
FIGURE 4.
Effect of incubation of the SL fraction in the atmosphere of pure O2 and tissue storage at −80 °C in contact with air on the response of the Na,K-ATPase to hypoxia or GSSG treatment. A, effect of various concentrations of GSSG on the Na,K-ATPase function in freshly prepared sarcolemmal membranes (filled triangles) or sarcolemmal membranes pre-exposed to an atmosphere of 100% O2 for 30 min before GSSG treatment (open squares) n = 4 per condition, means ± S.D. B, Na,K-ATPase activity in crude ventricular tissue homogenates prepared from ventricular tissue and stored for 4–8 weeks either at −80 °C in contact with air (gray bars) or in an atmosphere of liquid nitrogen (black bars). Data are presented as a mean of five independent experiments ± S.D. Asterisk indicates significant differences (p = 0.0078) relative to the corresponding N2-stored normoxic control as determined by the two-tailed unpaired t test.
FIGURE 5.
FIGURE 5.
Regulation of the Na,K-ATPase in rat heart by S-glutathionylation. A, activity of the Na,K-ATPase in crude homogenate prepared from normoxic (Norm) and hypoxic (Hyp) hearts. n = 5 per condition. Asterisk denotes p = 0.0039. B, effects of 100 μm DTT and GRX/NADPH-catalyzed (0.6 units of GRX/200 μm NADPH) S-glutathionylation by 300 μm GSH on Na,K-ATPase activity in normoxic crude ventricular homogenates. n = 4 per group. Asterisk indicates p = 0.0059 relative to the nontreated crude homogenate sample as determined by the two-tailed paired t test. C, dose-dependent GSH-induced S-glutathionylation (open bars) and the corresponding changes in the activity of the enzyme (line) in crude homogenate treated with glutathione reductase and 0.6 units GRX/200 μm NADPH. n = 4. D, effect of GSSG-induced glutathionylation and GRX-catalyzed deglutathionylation on the enzyme function in sarcolemmal membranes prepared from normoxic crude homogenate. S-Glutathionylation was induced by treating the sarcolemmal membranes with 300 μm GSSG and reversed with 0.6 units of GRX/200 μm NADPH. Data are represented as the mean of four hearts per condition ± S.D. Shown in the upper panel is a representative Western blot for the total and S-glutathionylated α1 subunit. * denotes p = 0.0001 compared with the GRX-treated control (Con) and # stands for p = 0.002 compared with the sample treated with GSSG alone. E, differential sensitivity of the α1 and α2 isozymes to the inhibitory action of GSSG. Activity of the Na,K-ATPase (α1 + α2) or the α1 isozyme alone was assessed in sarcolemmal membranes prepared from the normoxic heart treated with various GSSG concentrations. Activity of the α2 isozyme was calculated by subtracting the activity of the α1 isoform from the total Na,K-ATPase activity. Fitting of the plots with double (α1 + α2) or single (α1 or α2 alone) logistic sigmoidal functions was performed giving apparent IC50 values for α1 as 271.1 ± 1.7 μm and for α2 as 43.6 ± 9.2 μm. Gray bars and the lower panel show the changes in S-glutathionylation of the α1 subunit followed by the corresponding changes in the enzyme activity. n = 5 per group. All plotted data are represented as mean values ± S.D.
FIGURE 6.
FIGURE 6.
Competition between nucleotides and GSSG for the Na,K-ATPase nucleotide-binding site. A, pretreatment of the Na,K-ATPase prevents the dose-dependent activation of the Na,K-ATPase with ATP. Na,K-ATPase purified from rabbit kidney was preincubated both in the presence and absence 70 μm GSSG for 25 min and then its activity was measured as a function of ATP availability. The data are represented as mean values ± S.D. n = 3. B, ATP causes dose-dependent prevention of the inhibitory action of 1 mm GSSG when ATP and GSSG are simultaneously present in the incubation medium. The data are represented as mean values ± S.D. n = 3. C, inhibitory effect of S-glutathionylation on the ADP binding to Na,K-ATPase. An original isothermal titration calorimetry recording (upper panel) and binding isotherms (lower panel) of the Na,K-ATPase interaction with ADP in the presence of DTT (100 μM, black) or GSSG (1 mm, red) at 25 °C. D, localization of S-glutathionylation sites on the α1 subunit. Membrane domains of the α1 subunit are shown as barrels numbered as M1–M10. Cytosolic or extracellular domains are shown as lines, where the ouabain-binding site is shown in blue and nucleotide binding domain is in red. “C” and “N” indicate the C and N terminus. Cysteine residues are presented as filled circles with numbers corresponding to the duck/rabbit/rat α1 sequence. Cysteines, which undergo S-glutathionylation upon GSH/GSSG treatment, are shown in red. The Cys-236 absent in the α1 but present in the α2 isozyme is shown in green.
FIGURE 7.
FIGURE 7.
S-Glutathionylation of the α subunit as a mechanism of regulation of the Na,K-ATPase. A, superimposition of the three-dimensional structures of the nucleotide binding domain (Arg-378 to Arg-589) with ATP A or glutathione B bound to Cys-452p, -456p, and -457p. Shown as a ribbon diagram is a model created on the basis of 3.5-Å structure of the porcine α1 subunit (Protein Data Bank code 3b8e). The structural alignment was simulated with the program MOE. Glutathione is shown as a ball-and-stick representation, and ATP is presented as a space-filling van der Waals representation with atoms in standard colors for atom type (carbon, gray; oxygen, red; nitrogen, blue; sulfur, yellow; phosphorus, pink). The distance between the negatively charged phosphate ATP tail and the negatively charged carboxyl group of the glutathione bound to the Cys-452p is shown in green and is less than 8 Å. B, schematic representation of the regulatory S-glutathionylation of the Na,K-ATPase. The enzyme is shown in dynamic equilibrium between three distinct states as follows: “turned on” (active, regulated), “turned off” (reversibly inhibited), and “partially inhibited.” Transformation to the “unregulated” state is irreversible. Maximal activity of the enzyme may be achieved under the conditions supporting the optimal redox environment. Mild oxidation (GSSG accumulation coupled to ATP depletion or –SH to –SOH transformation of the cysteine residues in the partially inhibited mode) or GSH overload in the presence of GRX transfers the Na,K-ATPase from turned-on to the turned-off state in which the regulatory cysteines are S-glutathionylated. Severe oxidative stress causes oxidation of the –SH groups of the regulatory cysteines to –SO2H or –SO3H and thus turns the enzyme into the unregulated state, in which it is unable to respond to the changes in redox state and remains constantly active.

Similar articles

Cited by

References

    1. Blanco G., Mercer R. W. (1998) Isozymes of the Na-K-ATPase. Heterogeneity in structure, diversity in function. Am. J. Physiol. 275, F633–F650 - PubMed
    1. Glitsch H. G. (2001) Electrophysiology of the sodium-potassium-ATPase in cardiac cells. Physiol. Rev. 81, 1791–1826 - PubMed
    1. Geering K. (2008) Functional roles of Na,K-ATPase subunits. Curr. Opin. Nephrol. Hypertens. 17, 526–532 - PubMed
    1. Kaplan J. H. (2002) Biochemistry of Na,K-ATPase. Annu. Rev. Biochem. 71, 511–535 - PubMed
    1. Bogdanova A., Petrushanko I., Boldyrev A., Gassmann M. (2006) Oxygen- and redox-induced regulation of the Na/K-ATPase. Curr. Enzyme Inhibition 2, 37–59

Publication types

LinkOut - more resources