Identification of soil bacteria susceptible to TiO2 and ZnO nanoparticles
- PMID: 22798374
- PMCID: PMC3426698
- DOI: 10.1128/AEM.00941-12
Identification of soil bacteria susceptible to TiO2 and ZnO nanoparticles
Abstract
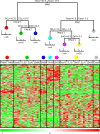
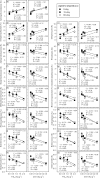
Because soil is expected to be a major sink for engineered nanoparticles (ENPs) released to the environment, the effects of ENPs on soil processes and the organisms that carry them out should be understood. DNA-based fingerprinting analyses have shown that ENPs alter soil bacterial communities, but specific taxon changes remain unknown. We used bar-coded pyrosequencing to explore the responses of diverse bacterial taxa to two widely used ENPs, nano-TiO(2) and nano-ZnO, at various doses (0, 0.5, 1.0, and 2.0 mg g(-1) soil for TiO(2); 0.05, 0.1, and 0.5 mg g(-1) soil for ZnO) in incubated soil microcosms. These ENPs significantly altered the bacterial communities in a dose-dependent manner, with some taxa increasing as a proportion of the community, but more taxa decreasing, indicating that effects mostly reduced diversity. Some of the declining taxa are known to be associated with nitrogen fixation (Rhizobiales, Bradyrhizobiaceae, and Bradyrhizobium) and methane oxidation (Methylobacteriaceae), while some positively impacted taxa are known to be associated with the decomposition of recalcitrant organic pollutants (Sphingomonadaceae) and biopolymers including protein (Streptomycetaceae and Streptomyces), indicating potential consequences to ecosystem-scale processes. The latter was suggested by a positive correlation between protease activity and the relative abundance of Streptomycetaceae (R = 0.49, P = 0.000) and Streptomyces (R = 0.47, P = 0.000). Our results demonstrate that some metal oxide nanoparticles could affect soil bacterial communities and associated processes through effects on susceptible, narrow-function bacterial taxa.
Figures


References
-
- Adams LK, Lyon DY, Alvarez PJ. 2006. Comparative eco-toxicity of nanoscale TiO2, SiO2, and ZnO water suspensions. Water Res. 40:3527–3532 - PubMed
-
- Anderson MJ. 2001. A new method for non-parametric multivariate analysis of variance. Austral. Ecol. 26:32–46
-
- Battin TJ, Kammer FV, Weilhartner A, Ottofuelling S, Hofmann T. 2009. Nanostructured TiO2: transport behavior and effects on aquatic microbial communities under environmental conditions. Environ. Sci. Technol. 43:8098–8104 - PubMed
-
- Bernhardt ES, et al. 2010. An ecological perspective on nanomaterial impacts in the environment. J. Environ. Qual. 39:1954–1965 - PubMed
-
- Brayner R, et al. 2006. Toxicological impact studies based on Escherichia coli bacteria in ultrafine ZnO nanoparticles colloidal medium. Nano Lett. 6:866–870 - PubMed
Publication types
MeSH terms
Substances
LinkOut - more resources
Full Text Sources
Other Literature Sources
Medical

