Review
. 2012;4(8):689-99.
doi: 10.1093/gbe/evs055. Epub 2012 Jul 12.

Horizontal transposon transfer in eukarya: detection, bias, and perspectives

Affiliations
Review

Horizontal transposon transfer in eukarya: detection, bias, and perspectives

Gabriel Luz Wallau et al. Genome Biol Evol. 2012.

Abstract

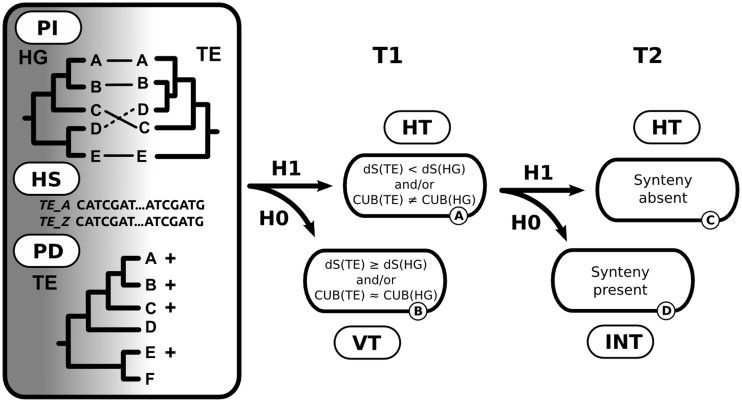
The genetic similarity observed among species is normally attributed to the existence of a common ancestor. However, a growing body of evidence suggests that the exchange of genetic material is not limited to the transfer from parent to offspring but can also occur through horizontal transfer (HT). Transposable elements (TEs) are DNA fragments with an innate propensity for HT; they are mobile and possess parasitic characteristics that allow them to exist and proliferate within host genomes. However, horizontal transposon transfer (HTT) is not easily detected, primarily because the complex TE life cycle can generate phylogenetic patterns similar to those expected for HTT events. The increasingly large number of new genome projects, in all branches of life, has provided an unprecedented opportunity to evaluate the TE content and HTT events in these species, although a standardized method of HTT detection is required before trends in the HTT rates can be evaluated in a wide range of eukaryotic taxa and predictions about these events can be made. Thus, we propose a straightforward hypothesis test that can be used by TE specialists and nonspecialists alike to discriminate between HTT events and natural TE life cycle patterns. We also discuss several plausible explanations and predictions for the distribution and frequency of HTT and for the inherent biases of HTT detection. Finally, we discuss some of the methodological concerns for HTT detection that may result in the underestimation and overestimation of HTT rates during eukaryotic genome evolution.


Figures

F<sc>ig</sc>. 1.—
Fig. 1.—
A schematic representation of a hypothesis test for discerning between HT and the natural stages of the TE life cycle. BOX: The first line of evidence for HTT: Phylogenetic incongruence (PI) between the host and TE phylogenies. Patchy distribution (PD) of a given TE within a group of species and high similarity (HS) between the TEs from different species. T1—The first test to distinguish between HTT and vertical transmission (VT)—comparing the dS between the TE and host genes (HGs) and species-specific codon usage bias (CUB). H0—vertical transfer is more probable if the dS values for the TEs are greater than or equal to the dS values of the vertically transmitted host genes and if the TE codon usage bias is similar to the codon usage bias in the host species. H1—HT will be selected if the TE’s dS value is significantly lower than the dS values of the vertically transmitted host genes or if the TE codon usage bias is different from the host species codon usage bias. T2—A second step can be used to evaluate HTT between closely related species. H0—If there is synteny beyond the border of the TE copies, it is more probable that these copies were shared by hybridization among the host species (an introgression [INT] occurred). H1—If there is no synteny, it is more probable that these copies were shared by an HTT event between host species.
F<sc>ig</sc>. 2.—
Fig. 2.—
A representation of the genome projects, TEs, and number of HTT events in each major eukaryotic taxon. (A) The number of genome projects from the NCBI database (corresponding to cycle size and the number after the branch name, respectively) and TE RepBase entries (indicated by the number within the parentheses) in each major branch of the tree of life. (B) TE superfamily classifications based on RepBase. (C) The distribution of HTT events in each major eukaryotic taxon. (D) Distribution of HTT events within Animalia. The colors represent the TE superfamilies described in (B), and the cycle size represents the number of HTT events for each host taxon.
F<sc>ig</sc>.
3.—
Fig. 3.—
The underestimation and overestimation of HTT events. (A) The host species’ phylogenies that represent HTTs at different evolutionary times (HTT1 and HTT2). (B) In HTT1, as the TEs evolve under neutral- or weak-natural selection, the dS value will increase over time (T1–T2–T3), and the species-specific codon usage bias from the donor species will be lost (resulting in the underestimation of old events). (C) In HTT2, all the TE-dS comparisons among species E, F, G, and H will be significantly lower than the HG’s dS due to the maintenance of only one HT signal. (D) The host species’ phylogenies that represent a more complex scenario with three HTT events (I, II, and III). (E) The TE dS patterns resulting from the HTT events in (D).

References

    1. Anderson JO. Lateral gene transfer in eukaryotes. Cell Mol Life Sci. 2005;62:1182–1197. - PMC - PubMed
    1. Bartolomé C, Bello X, Maside X. Widespread evidence for horizontal transfer of transposable elements across Drosophila genomes. Genome Biol. 2009;10:R22. - PMC - PubMed
    1. Bergman CM, Quesneville H. Discovering and detecting transposable elements in genome sequences. Brief Bioinform. 2007;8:382–392. - PubMed
    1. Biémont C, Vieira C. Junk DNA as an evolutionary force. Nature. 2006;443:521–524. - PubMed
    1. Boer J de, Yazawa R, Davidson W, Koop B. Bursts and horizontal evolution of DNA transposons in the speciation of pseudotetraploid salmonids. BMC Genomics. 2007;8:422. - PMC - PubMed

Publication types

Substances