. 2012 Oct;22(10):2067-78.
doi: 10.1101/gr.137901.112. Epub 2012 Jul 12.

Incorporating RNA-seq data into the zebrafish Ensembl genebuild

Affiliations

Incorporating RNA-seq data into the zebrafish Ensembl genebuild

John E Collins et al. Genome Res. 2012 Oct.

Abstract

Ensembl gene annotation provides a comprehensive catalog of transcripts aligned to the reference sequence. It relies on publicly available species-specific and orthologous transcripts plus their inferred protein sequence. The accuracy of gene models is improved by increasing the species-specific component that can be cost-effectively achieved using RNA-seq. Two zebrafish gene annotations are presented in Ensembl version 62 built on the Zv9 reference sequence. Firstly, RNA-seq data from five tissues and seven developmental stages were assembled into 25,748 gene models. A 3'-end capture and sequencing protocol was developed to predict the 3' ends of transcripts, and 46.1% of the original models were subsequently refined. Secondly, a standard Ensembl genebuild, incorporating carefully filtered elements from the RNA-seq-only build, followed by a merge with the manually curated VEGA database, produced a comprehensive annotation of 26,152 genes represented by 51,569 transcripts. The RNA-seq-only and the Ensembl/VEGA genebuilds contribute contrasting elements to the final genebuild. The RNA-seq genebuild was used to adjust intron/exon boundaries of orthologous defined models, confirm their expression, and improve 3' untranslated regions. Importantly, the inferred protein alignments within the Ensembl genebuild conferred proof of model contiguity for the RNA-seq models. The zebrafish gene annotation has been enhanced by the incorporation of RNA-seq data and the pipeline will be used for other organisms. Organisms with little species-specific cDNA data will generally benefit the most.


Figures

Figure 1.
Figure 1.
RNA-seq only gene models and 3′-end pull-down pipelines. (A) Illumina reads (short black lines) were matched to repeat-masked genomic reference sequence (long black line) using exonerate, and clusters were called as potential exons (gray boxes). Read pair information was used to identify adjacent exons belonging to the same gene (dashed lines). A rough gene model was built (white boxes are exons and angled black lines are introns). A total of 20 bases of genomic sequence were added to each side of the exons, and exons within a rough model were concatenated. Illumina reads were mapped again to the concatenated rough models using exonerate est2genome probabilistic splice model (gray lines are the aligned portion and the black slash lines show the breaks across the intron, identifying intron spanning reads). Exons were trimmed or extended to the identified splice sites and located back on the genome reference. The splice sites were used to identify the correct strand, and the longest open reading frame was predicted in each refined gene model (black are untranslated regions and gray boxes are coding). 3p markers were located at the 3′ end of the gene (black arrow) and the models were extended or trimmed as necessary. (B) Total RNA was chemically fragmented (short black lines), a 5′ biotinylated polyT22 anchored primer containing a BpmI site (underlined) (GGCCAGTCCTGGAGTTTTTTTTTTTTTTTTTTTTTTVN) was annealed and bound to a streptavidin magnetic bead (gray circle). The polyA RNA fragments were pulled down with a magnet, the rest of the RNA was thrown away and double-stranded cDNA was synthesized. The cDNA was released from the beads by restriction digest with BpmI, which cuts 16 bases upstream of the recognition site, leaving 6 T bases at the 5′ end of the fragment. Standard Illumina libraries were made, followed by paired end sequencing of 76 bases each. Fragments with a 3′ polyA (5′ polyT) resulted in two reads where one read began with T bases derived from the polyA pull-down oligo. If there were at least five T bases, all of the T bases were removed; this was normally six T bases to produce 70/76 base pair of reads. These were mapped to the genomic reference sequence (gray arrows) with the 5′ end of the 70-base read indicating a possible polyA addition site as well as the orientation of the transcript. These were filtered for duplicate read pairs, the proximity of a BpmI site in the genome sequence, polyA or degenerate polyA adjacent to the proposed 3′ end, the orientation of the proposed 3′ end compared with the gene model and for model extension the presence of overlapping genes on the other strand. The original RNA-seq models were not extended more than 5001 bases. If more than three reads satisfied all of the filters, the genomic coordinate of the 3p marker was predicted (black arrow).
Figure 2.
Figure 2.
The Ensembl browsers from release 62 between 15: 6,348,671-6,373,413 shows the transcript ENSDART00000065824 for the gene bace2. This transcript was annotated from species-specific cDNAs BC164206.1, BC083415.1, and BC098874.1. Matching BC098874.1 to the Zv9 assembly using Ensembl suggests that the 5′ end matches four exons in the reference sequence as annotated in ENSDART00000065824, the central portion matches four exons over 340,000 bases away between 15:6,718,308 and 6,725,702, and the 3′ end matches two exons adjacent to the first four exons between 15:6,379,504 and 6,383,732 (note that the sequence of the short fourth exon of the central portion can be found at the 5′ end of the first exon of the final two exons and is probably an artifact of the read alignment process). This shuffled exon order suggests a reference sequence assembly problem. On closer inspection, apart from the first three exons, the transcript is aligned to capillary and Illumina whole-genome shotgun assemble rather than the more reliable genomic clone sequence. The underlining reference sequence of the central four exons appears to be incorrectly located on chromosome 15. The Ensembl genebuild has create the longest single transcript from the cDNA. Interestingly, the RNA-seq-only genebuild has a model in all three locations. The first four exons match RNASEQT00000017627, the middle three exons match RNASEQT00000017630 creating a partial additional gene, and the final two exons match RNASEQT00000017175. The RNA-seq genebuild is unable to join the first four exons to the last two exons because three exons and four introns are missing. This example demonstrates annotation problems associated with errors in the reference sequence. Expanding this principle to other species, the degree of disrupted transcripts will be related to the quality of the assembly. It also highlights how a break in transcript contiguity can be caused by incomplete exon or intron data that could arise, for example, from low read coverage.
Figure 3.
Figure 3.
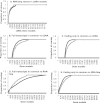
Intron, exon, and base coverage of cDNA-supported Ensembl gene models. The full transcript, and if available, corresponding protein-coding regions of 8822 cDNA-supported Ensembl models were extracted from Ensembl version 60. (A) All of the introns from the 8504 multiexon full transcripts were compared with the RNA-seq intron database and scored positive if there was an exact match. The proportion of exact match introns was calculated for each transcript individually and plotted (dark gray). The process was repeated for the protein-coding portion of 8227 multiexon gene models (light gray). (B) The 8822 cDNA-supported Ensembl models were compared with the RNA-seq models, and the single best overlap model was identified. The proportion of intersecting nucleotides (dark gray) and exons (light gray) compared with the cDNA-supported models was calculated for each gene model and plotted. (C) The same calculation as in B using only the protein-coding regions. (D) The 7801 cDNA-supported Ensembl models that overlap an RNA-seq model were compared. The proportion of intersecting nucleotides (dark gray) and exons (light gray) compared with the best overlap RNA-seq model was calculated for each gene model and plotted. (E) The same calculation as in D using 7386 cDNA-supported models where the best match full transcript was from the same RNA-seq model as the best match coding region. Exon matching in B–E did not include the transcription start or stop.
Figure 4.
Figure 4.
Gene model end prediction. (A) The 3′ end of RNA-seq models from the original genebuild were compared with 3p marker data and scored as trimmed, extended, confirmed (if identical), or left unchanged. The 3p altered RNA-seq models were matched to their cDNA-supported Ensembl model pair, and 5311 passed a series of filters, including pairs where the best match whole transcript coincided with the best match coding region, both ORFs stopped at the same genomic coordinate, and there were no introns in either of the 3′ UTR regions, thus excluding fused gene models. The 3′ UTR length was compared; in 1063 cases the cDNA model was found to be longer, in 2875 cases the RNA-seq model was longer, and in 1373 cases they were exactly the same. The length of the 3′ UTR of model pairs was compared, the difference in length calculated, and shown on the y-axis. Model pairs where the RNA-seq transcript is longer are in the bottom light-blue section, the pairs where the cDNA-supported Ensembl transcript is longer are in the top dark-blue section, and the pairs with identical length are in the middle. The model pairs with the specified length difference are shown for all four possible 3p marker alterations (trimmed in green, extended in red, confirmed in blue, and unchanged in purple). The length of the bar indicates the number of model pairs with the indicated length difference after the 3p marker alteration performed. (B) The 3289 trimmed RNA-seq-only models filtered as above are shown. The blue bars show the 3′ UTR length after trimming, the red bars show the length trimmed, and the blue plus red bars show the original 3′ UTR length. (C) Filtered RNA-seq models extended by 3p marker data are shown. The blue bars show the 3′ UTR length after the original RNA-seq genebuild before extension, while the green plus red bars show the length of extension. The green bars show the total number of bases covered by RNA-seq reads and the red bars the total number of bases not covered, these are not necessarily consecutive. For clarity, only the models with 10 or more bases not confirmed by RNA-seq sequence are shown. Note that the RNA-seq libraries are not directional, so it is possible that the reads used for this confirmation are on the opposite strand. (D) The 3078 cDNA-supported Ensembl transcripts that share a start codon within the first exon with an RNA-seq-only model were compared. The y-axis shows the difference in length between model pairs, with the green regions indicating where the cDNA-supported Ensembl transcript is longer and the blue region indicating where the RNA-seq-only model is longer.
Figure 5.
Figure 5.
The transcript composition of Ensembl genes. The GeneBuilder collapses multiple transcripts into single gene identifiers. The transcripts can be derived from one of three sources. The Venn diagram indicates the number of Ensembl genes comprised of transcripts from the three different sources.

References

    1. Bentley DR, Balasubramanian S, Swerdlow HP, Smith GP, Milton J, Brown CG, Hall KP, Evers DJ, Barnes CL, Bignell HR, et al. 2008. Accurate whole human genome sequencing using reversible terminator chemistry. Nature 456: 53–59 - PMC - PubMed
    1. Cloonan N, Forrest AR, Kolle G, Gardiner BB, Faulkner GJ, Brown MK, Taylor DF, Steptoe AL, Wani S, Bethel G, et al. 2008. Stem cell transcriptome profiling via massive-scale mRNA sequencing. Nat Methods 5: 613–619 - PubMed
    1. Curwen V, Eyras E, Andrews TD, Clarke L, Mongin E, Searle SM, Clamp M 2004. The Ensembl automatic gene annotation system. Genome Res 14: 942–950 - PMC - PubMed
    1. Denoeud F, Aury JM, Da Silva C, Noel B, Rogier O, Delledonne M, Morgante M, Valle G, Wincker P, Scarpelli C, et al. 2008. Annotating genomes with massive-scale RNA sequencing. Genome Biol 9: R175 doi: 10.1186/gb-2008-9-12-r175 - PMC - PubMed
    1. Flicek P, Amode MR, Barrell D, Beal K, Brent S, Chen Y, Clapham P, Coates G, Fairley S, Fitzgerald S, et al. 2011. Ensembl 2011. Nucleic Acids Res 39: D800–D806 - PMC - PubMed

Publication types

LinkOut - more resources