. 2012 Aug 15;189(4):1627-38.
doi: 10.4049/jimmunol.1103271. Epub 2012 Jul 13.

A coreceptor-independent transgenic human TCR mediates anti-tumor and anti-self immunity in mice

Affiliations

A coreceptor-independent transgenic human TCR mediates anti-tumor and anti-self immunity in mice

Shikhar Mehrotra et al. J Immunol. .

Abstract

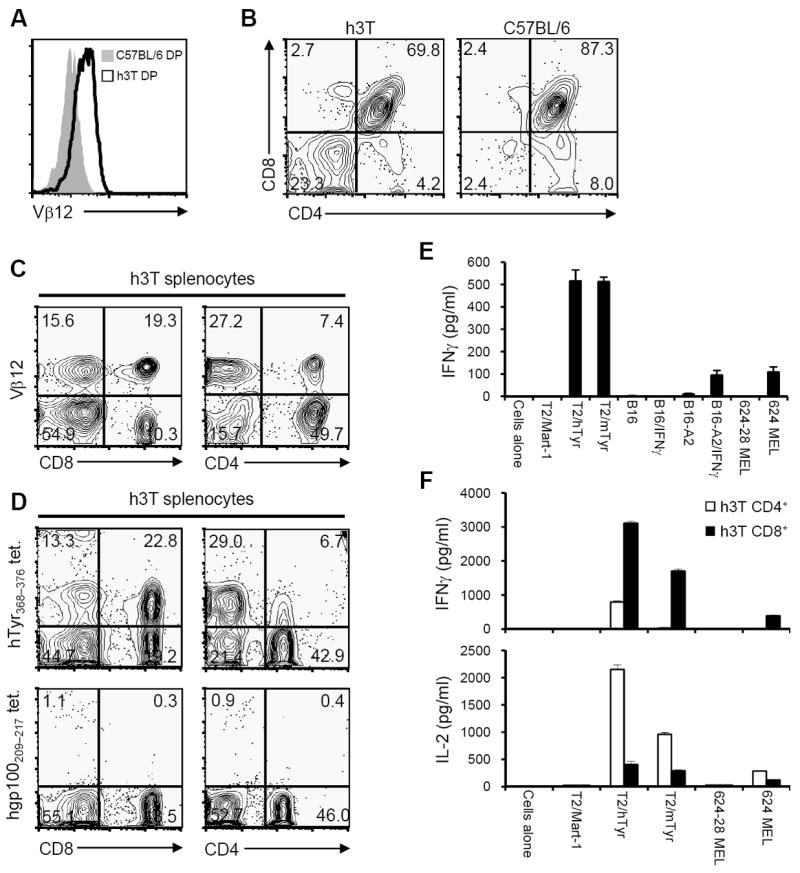
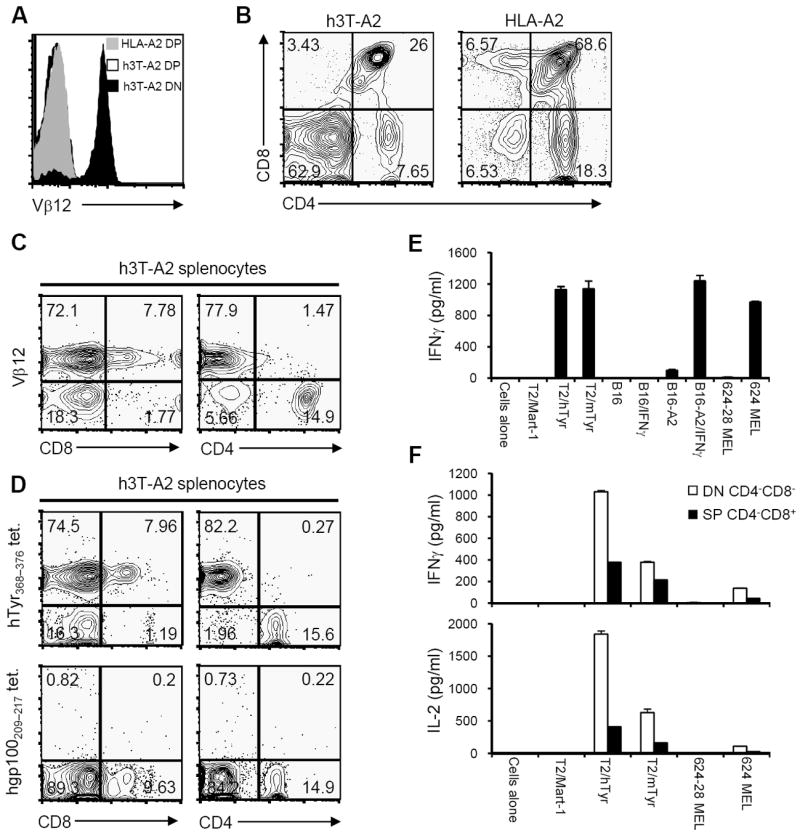
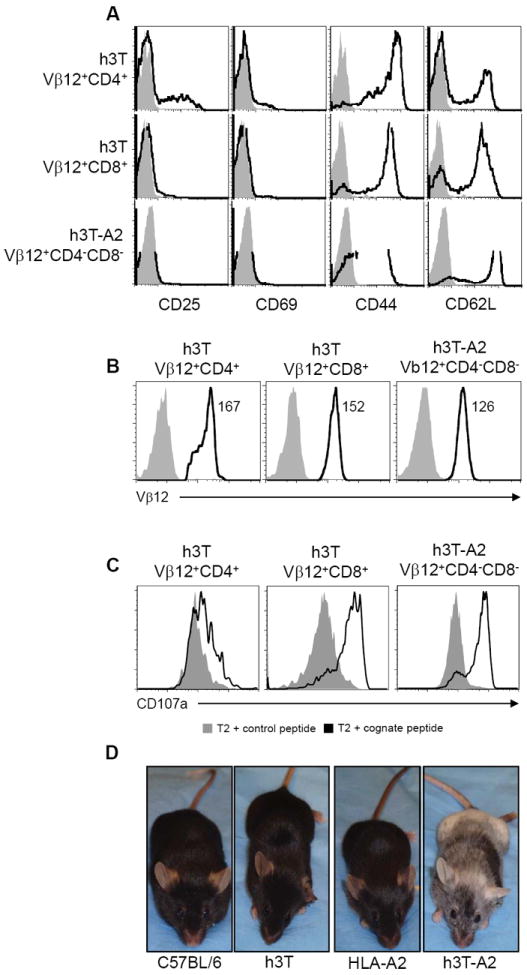
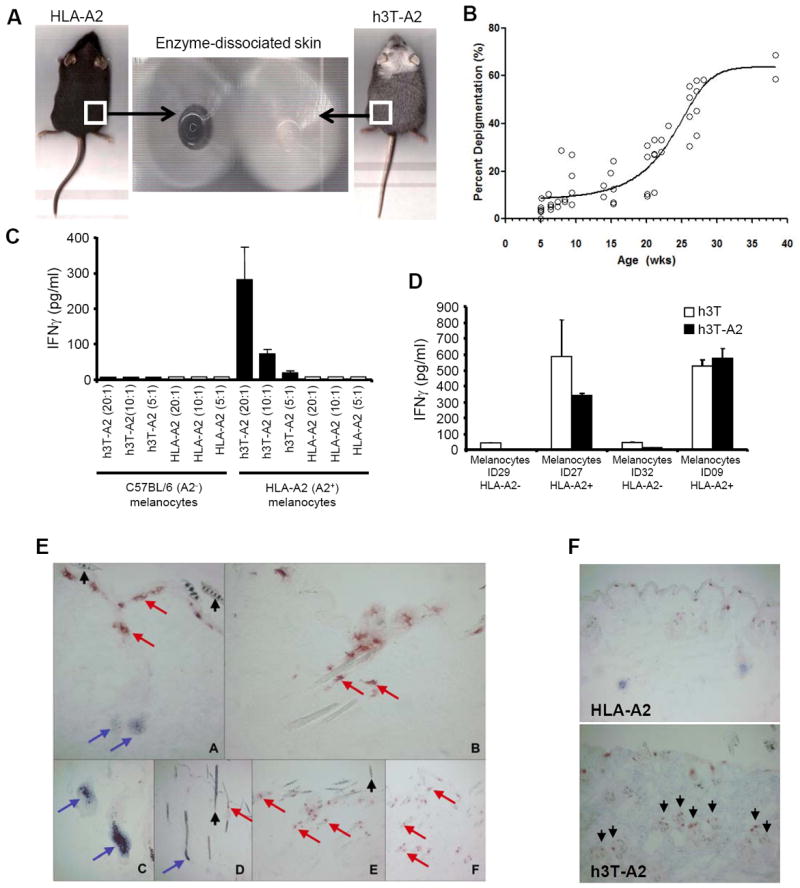
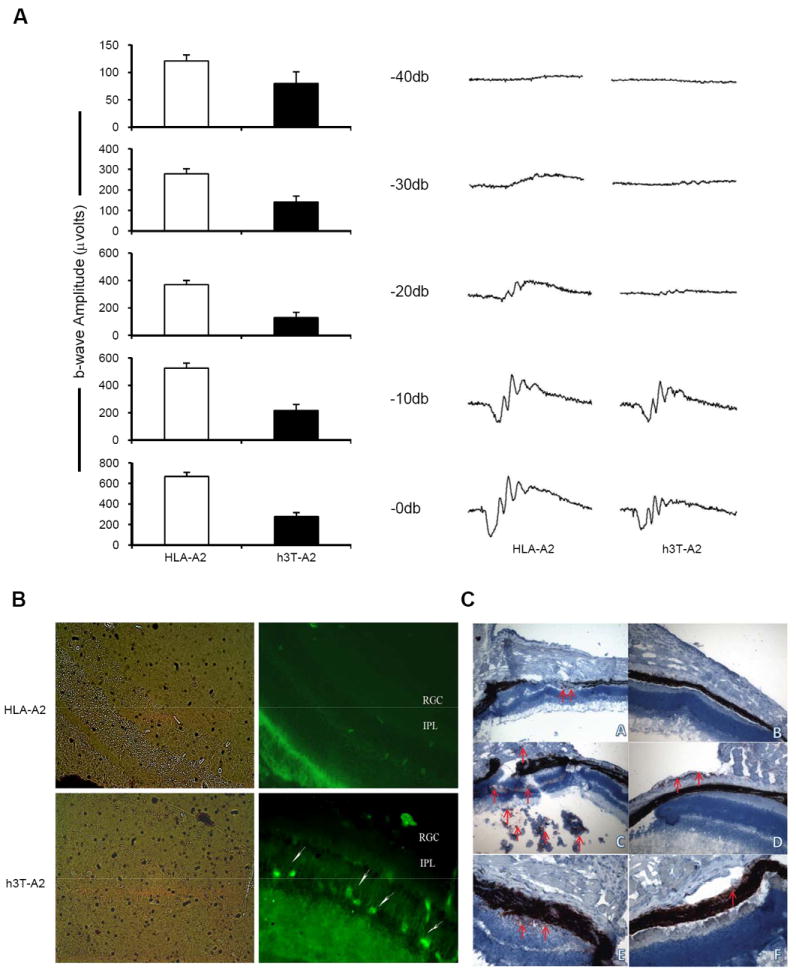
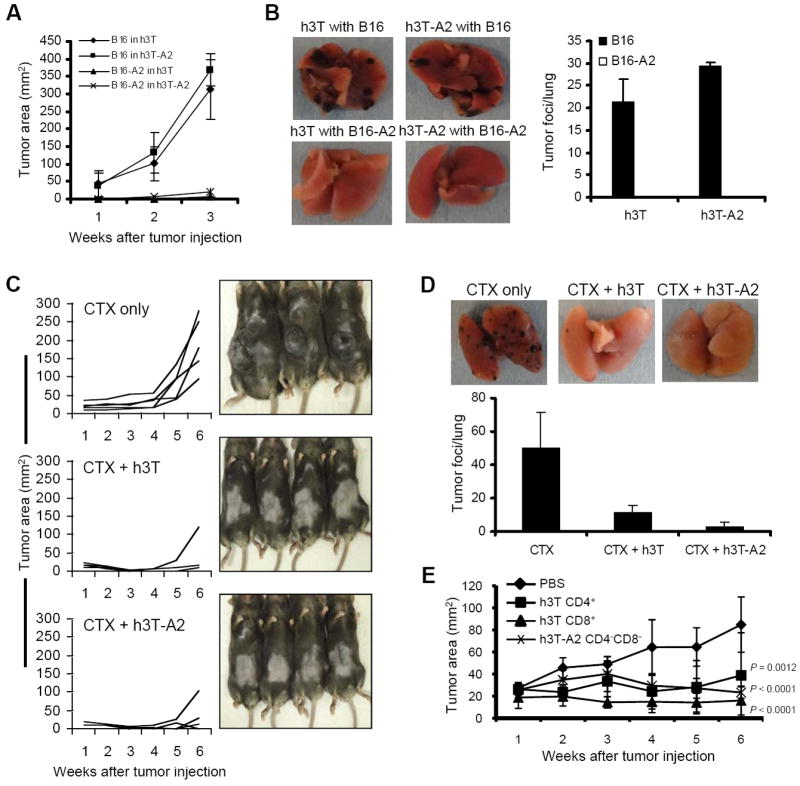
Recent advancements in T cell immunotherapy suggest that T cells engineered with high-affinity TCR can offer better tumor regression. However, whether a high-affinity TCR alone is sufficient to control tumor growth, or the T cell subset bearing the TCR is also important remains unclear. Using the human tyrosinase epitope-reactive, CD8-independent, high-affinity TCR isolated from MHC class I-restricted CD4(+) T cells obtained from tumor-infiltrating lymphocytes (TIL) of a metastatic melanoma patient, we developed a novel TCR transgenic mouse with a C57BL/6 background. This HLA-A2-restricted TCR was positively selected on both CD4(+) and CD8(+) single-positive cells. However, when the TCR transgenic mouse was developed with a HLA-A2 background, the transgenic TCR was primarily expressed by CD3(+)CD4(-)CD8(-) double-negative T cells. TIL 1383I TCR transgenic CD4(+), CD8(+), and CD4(-)CD8(-) T cells were functional and retained the ability to control tumor growth without the need for vaccination or cytokine support in vivo. Furthermore, the HLA-A2(+)/human tyrosinase TCR double-transgenic mice developed spontaneous hair depigmentation and had visual defects that progressed with age. Our data show that the expression of the high-affinity TIL 1383I TCR alone in CD3(+) T cells is sufficient to control the growth of murine and human melanoma, and the presence or absence of CD4 and CD8 coreceptors had little effect on its functional capacity.


Figures

FIGURE 1
FIGURE 1. Expression of human tyrosinase TCR on h3T mouse T cells and its function
A). Thymocytes from h3T and C57BL/6 control mice were stained using a TCR subunit specific human Vβ12 antibody. B). Thymocytes from h3T and C57BL/6 mice were stained with fluorochrome conjugated anti-CD4 and anti-CD8 antibody to determine single positive, double positive and double negative populations. C). h3T splenocytes were stained with fluorochrome conjugated anti-CD4, anti-CD8 followed by Vβ12 antibody. D). h3T splenocytes were stained with fluorochrome conjugated anti-CD4, anti-CD8 followed by human tyrosinase368-376 epitope reactive cognate tetramer (upper panel) or human glycoprotein100209-217 epitope reactive control tetramer reagent (lower panel). E). IFN-γ was measured by ELISA using supernatant obtained after overnight stimulation of h3T splenocytes as effectors and human or mouse tyrosinase peptide pulsed T2 cells, HLA-A2 transduced mouse melanoma B16 used untreated or after treatment with IFN-γ overnight, HLA-A2+ human melanoma 624 MEL as cognate stimulators. MART-127-35 peptide pulsed T2 cells, mouse melanoma B16 untreated or after treatment with IFN-γ overnight and HLA-A2- human melanoma 624-28 MEL served as controls. F). Supernatants obtained after overnight stimulation of sorted Vβ12+CD4+ and Vβ12+CD8+ effector T cells from h3T mouse were co-cultured with human or mouse tyrosinase peptide pulsed T2 cells and HLA-A2+ human melanoma 624 MEL as stimulators. Flu-MP58-66 peptide pulsed T2 cells and HLA-A2- human melanoma 624-28 MEL served as controls. Data shown in A-E are from one representative of five experiments performed and in F from one of two experiments.
FIGURE 2
FIGURE 2. Expression of human tyrosinase TCR on h3T-A2 mouse T cells and its function
A). Thymocytes from h3T-A2 and HLA-A2 control mouse were stained using TCR specific human Vβ12 antibody. Vβ12 expression on CD4+CD8+ positive cells was determined on HLA-A2 mice (grey histogram) and h3T-A2 mice (open histogram). Black histogram represents Vβ12 expression on CD4- CD8- cells from h3T-A2 mice. B). Thymocytes from h3T-A2 and HLA-A2 mice were stained with fluorochrome conjugated anti-CD4 and anti-CD8 antibody to determine single positive, double positive and double negative populations. C). h3T-A2 splenocytes were stained with fluorochrome conjugated anti-CD4, anti-CD8 followed by Vβ12 antibody. D). h3T-A2 splenocytes were stained with fluorochrome conjugated anti-CD4, anti-CD8 followed by human tyrosinase368-376 epitope reactive cognate tetramer (upper panel) or human glycoprotein100209-217 epitope reactive control tetramer reagent (lower panel). E). IFN-γ was measured by ELISA using supernatant obtained after overnight stimulation of h3T-A2 splenocytes as effectors and human or mouse tyrosinase peptide pulsed T2 cells, HLA-A2 transduced mouse melanoma B16 used untreated or after treatment with IFN-γ overnight or HLA-A2+ human melanoma 624 MEL as cognate stimulators. MART-127-35 peptide pulsed T2 cells, mouse melanoma B16 used untreated or after treatment with IFN-γ overnight and HLA-A2- human melanoma 624-28 MEL served as controls. F). Supernatant using FACS sorted Vβ12+CD4-CD8- double negative T cells from h3T-A2 mouse was obtained as mentioned in E) and different cytokine were evaluated using the BD Cytometric Bead Array System. Data shown in A-E are from one representative of five experiments performed and in F from one of two experiments.
FIGURE 3
FIGURE 3. Phenotypic characterization of h3T and h3T-A2 splenocytes
A). Splenocytes from h3T and h3T-A2 mouse were stained using fluorochrome conjugated TCR specific human anti-Vβ12, anti-CD4, anti-CD8 antibody along with the indicated cell surface antibody. Grey histogram indicates staining with isotype control and open histogram indicate the cell surface expression level on the gated T cells as indicated on left. B). Splenocytes from h3T and h3T-A2 mouse were stained using fluorochrome conjugated TCR specific human anti-Vβ12, anti-CD4, anti-CD8 antibody. Grey histogram indicates staining with isotype control and open histogram indicate the Vβ12 expression level on the gated T cells as indicated on top. C). h3T and h3T-A2 splenocytes were stimulated overnight with human tyrosinase cognate peptide-pulsed T2 cells. CD107a expression was determined by flow cytometry on Vβ12+CD4+, Vβ12+CD8+ and Vβ12+CD4-CD8- T cells. MART-127-35 peptide-pulsed T2 cells were used as control. Grey histogram indicates staining with isotype control and open histogram indicate the CD107a expression level on the gated T cells as indicated on top. D). Spontaneous depigmentation at 10 weeks of age in h3T-A2 mouse as compared to age matched C57BL/6, h3T and HLA-A2 controls.
FIGURE 4
FIGURE 4. Effect of TCR transgenic T cells on skin pigmentation
A). Enzyme dissociated skin section was obtained from h3T-A2 mice as described under material and methods with depigmentation and age matched HLA-A2 as controls, and imaged. B). h3T-A2 depigmentation over time was assessed after isofluorane sedation of mice and using a flatbed scanner. Mice were scanned, and images were corrected for ambient light from scan to scan using Adobe Photoshop. Mouse ventral images were inverted and a marquee was drawn to sample the scanned luminosities compared to a non-depigmented C57BL/6 mouse to determine percent depigmentation. A consistent pixel number was sampled for every time point. Percent depigmentation was determined by comparison to non-TCR transgenic mice. C). h3T-A2 splenocytes were co-cultured with mouse melanocytes generated from either C57BL/6 or HLA-A2 mice at various effector to target ratios and supernatants were evaluated for IFN-γ content by ELISA. (D). h3T and h3T-A2 splenocytes were co-cultured with human melanocytes generated from HLA-A2+ (ID27, ID09) or HLA-A2- (ID29, ID32) normal healthy donors and supernatant obtained was evaluated for IFN-γ secretion by ELISA. (E). Immunohistology of depigmenting skin in h3TA2. Melanocytes and T cells detected in skin obtained from HLA-A2 Tg (A, C, D) and h3T-A2 (B, E, F) mice using primary antibodies to TRP-1 and CD3, respectively. B, E at 5weeks; F at 20 weeks. Note complete loss of melanocytes (but not melanin) and T cell infiltration of hair follicles by 5 weeks of age. Arrows: Blue, TRP-1; Red, CD3, black, melanin. (F). Melanocytes and T cells were detected in skin obtained from HLA-A2 wild type mice (upper panel) and h3T-A2 mice (lower panel) using primary antibodies to TRP-1 and CD3, respectively. Note increased T cell infiltration by 5 wks. of age. Arrows mark CD3 staining.
FIGURE 5
FIGURE 5. Effect of TCR transgenic T cells on eye
(A). Retinal function in h3T-A2 mice. Representative electroretinograms (ERGs) from wild type and h3T-A2 mice eyes is shown on left panel. Bar diagrams on right panel demonstrate combined data for individual light intensity. Waveforms were recorded from over night dark-adapted wild type and h3T-A2 mice in response to a single 10 μs flash using UTAS-2000 system. Data are expressed as a mean ± SE (-40 dB, n=6-12, p=0.073; -30dB, n=6-15, **p=0.006; -20 dB, n=5-15, ***p=0.0007; -10 dB, n=5-15, ***p=0.0003; 0 dB, n=8-13, ***p=0.0001). (B). Localization of Vβ12 mRNA transcript in the retina was detected by in situ hybridization using human TCR specific fluorescein-labeled probes. Micrographs are representative of results obtained from eyes of four different animals. Left panel shows pictures taken in bright field and right panel shows fluorescent-labeled mRNA detection for Vβ12 in HLA-A2 and h3T-A2 mice. RGC, retinal ganglion cells; IPL, inner plexiform layer. White arrows indicate positive staining for Vβ12+ transgenic T-cells, 40X. (C). Affected (L) and unaffected (R) eye, 8 μm frozen section were stained indirectly with anti-Vβ12 1:200 (A, B); anti-CD68 Ab 1:50 (C, D); and anti-TRP-1 1:50 (E, F) (original magnification 200x), detecting antigen-specific T cells infiltrating through the retina, macrophage infiltrates and leaky retinal pigment epithelial cells in a representative affected eye, respectively. AEC staining using indirect immunoperoxidase labeling and hematoxilin counter staining.
FIGURE 6
FIGURE 6. In vivo function in h3T and h3T-A2 mouse
A). Murine melanoma B16 and B16-A2 (2.5 × 10⁵) were injected sub-cutaneously in h3T and h3T-A2 mice. Tumor growth was measured using digital calipers every fourth day. B). Murine melanoma B16 and B16-A2 (2.5 × 10⁵) were injected intravenously through tail vein in h3T and h3T-A2 mice. Mice were sacrificed after 21 days and tumor foci were evaluated in the lungs. Left panel shows picture of a representative lung from each group. Right panel shows the histogram representing the mean number of tumor foci observed per lung obtained from all five mice in each group. C). HLA-A2 mice (n = 5/group) were inoculated (sc) with 2.5 × 10⁵ murine B16-A2 melanoma cells and palpable tumors were treated with or without cyclophosphamide (CTX, 4 mg/mouse). CTX-injected mice were either left without further manipulation or adoptively transferred one day later with 1.0 ×10⁶ Vβ12+ cells harvested from h3T or h3T-A2 mice spleens. Tumor size was then recorded at the indicated time points. Experiment was repeated three times with similar results. D). HLA-A2 mice (n = 3/group) were inoculated (iv) with 2.5 × 10⁵ murine B16-A2 melanoma cells and treated with CTX (4 mg/mouse) after four days. CTX-injected mice were either left without further manipulation or adoptively transferred one day later with 1.0×10⁶ Vβ12+ cells harvested from h3T or h3T-A2 mice spleens. Four weeks after tumor injection, lungs were harvested from mice, and the number of metastatic foci was counted. The experiment was repeated three times with similar results. E). Human HLA-A2+ (624 MEL) and HLA-A2- (624-28 MEL) human melanomas were established in SCID/beige mice before palpable tumors were treated by adoptively transferring purified populations of 105 Vβ12+CD4+, Vβ12+CD8+ and Vβ12+CD4-CD8- h3T T cells. Mice that received PBS were used as controls. Tumor growth was measured using digital calipers every fourth day. Data in figure demonstrate mean tumor size at each time point per group. To compare growth trajectories across groups, random effects linear regression models were fit with log of tumor size as the outcome to adhere to linearity assumptions. Log of tumor size was regressed on time and statistical significance of differences in slopes (compared to the reference group) was assessed by p-values. P-values less than 0.05 were considered to be statistically significant. Data represent two independent experiments. N = 5 mice/group.

Similar articles

Cited by

References

    1. Rosenberg SA, Restifo NP, Yang JC, Morgan RA, Dudley ME. Adoptive cell transfer: a clinical path to effective cancer immunotherapy. Nature reviews. 2008;8:299–308. - PMC - PubMed
    1. Clay TM, Custer MC, Sachs J, Hwu P, Rosenberg SA, Nishimura MI. Efficient transfer of a tumor antigen-reactive TCR to human peripheral blood lymphocytes confers anti-tumor reactivity. J Immunol. 1999;163:507–513. - PubMed
    1. Duval L, Schmidt H, Kaltoft K, Fode K, Jensen JJ, Sorensen SM, Nishimura MI, von der Maase H. Adoptive transfer of allogeneic cytotoxic T lymphocytes equipped with a HLA-A2 restricted MART-1 T-cell receptor: a phase I trial in metastatic melanoma. Clin Cancer Res. 2006;12:1229–1236. - PubMed
    1. Morgan RA, Dudley ME, Wunderlich JR, Hughes MS, Yang JC, Sherry RM, Royal RE, Topalian SL, Kammula US, Restifo NP, Zheng Z, Nahvi A, de Vries CR, Rogers-Freezer LJ, Mavroukakis SA, Rosenberg SA. Cancer regression in patients after transfer of genetically engineered lymphocytes. Science (New York N Y. 2006;314:126–129. - PMC - PubMed
    1. Rosenberg SA, Yang JC, Restifo NP. Cancer immunotherapy: moving beyond current vaccines. Nature medicine. 2004;10:909–915. - PMC - PubMed

Publication types