. 2012 Aug 15;189(4):1708-16.
doi: 10.4049/jimmunol.1201271. Epub 2012 Jul 13.

Differential requirement for CD70 and CD80/CD86 in dendritic cell-mediated activation of tumor-tolerized CD8 T cells

Affiliations

Differential requirement for CD70 and CD80/CD86 in dendritic cell-mediated activation of tumor-tolerized CD8 T cells

S Peter Bak et al. J Immunol. .

Abstract

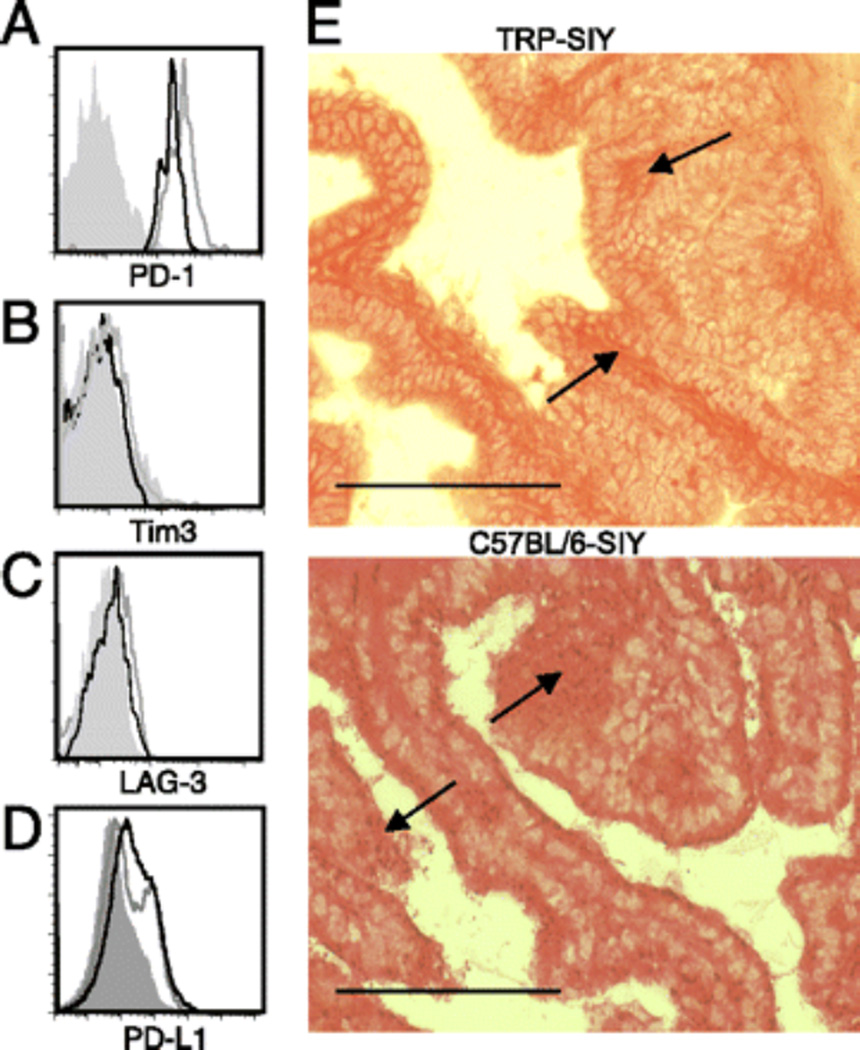
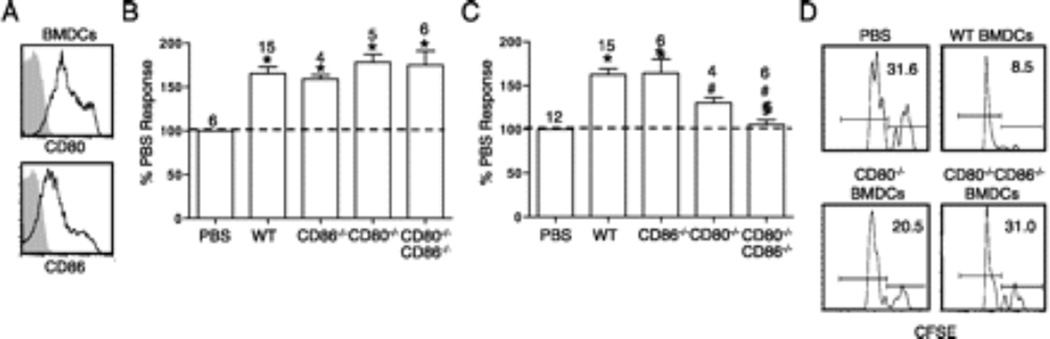
A major obstacle to efficacious T cell-based cancer immunotherapy is the tolerizing-tumor microenvironment that rapidly inactivates tumor-infiltrating lymphocytes. In an autochthonous model of prostate cancer, we have previously shown that intratumoral injection of Ag-loaded dendritic cells (DCs) delays T cell tolerance induction as well as refunctionalizes already tolerized T cells in the tumor tissue. In this study, we have defined molecular interactions that mediate the effects of DCs. We show that pretreating Ag-loaded DCs with anti-CD70 Ab abolishes the ability of DCs to delay tumor-mediated T cell tolerance induction, whereas interfering with 4-1BBL, CD80, CD86, or both CD80 and CD86 had no significant effect. In contrast, CD80(-/-) or CD80(-/-)CD86(-/-) DCs failed to reactivate already tolerized T cells in the tumor tissue, whereas interfering with CD70 and 4-1BBL had no effect. Furthermore, despite a high level of programmed death 1 expression by tumor-infiltrating T cells and programmed death ligand 1 expression in the prostate, disrupting programmed death 1/programmed death ligand 1 interaction did not enhance T cell function in this model. These findings reveal dynamic requirements for costimulatory signals to overcome tumor-induced tolerance and have significant implications for developing more effective cancer immunotherapies.


Figures

FIGURE 1
FIGURE 1
PD-1 is expressed on prostate resident T cells and PD-L1 on the prostate stroma. Naive 2C T cells were transferred into TRP-SIY mice, followed by intranasal infection with WSN-SIY virus. Prostates were harvested day 13 and day 36 post transfer, and Thy1.1+2C TCR+ cells were analyzed for PD-1 (A), Tim3 (B), or LAG-3 (C) expression. Histograms show relative levels of cell surface expression on 2C T cells at day 13 (gray) or day 36 (black), compared with isotype control (filled gray line). (D) Prostates from TRP-SIY (black) and C57BL/6-SIY (gray) mice were harvested and digested into single-cell suspension and stained with PD-L1 or isotype (filled gray line) and analyzed by flow cytometry. Histograms show relative levels of PD-L1 expression on prostate cells. (E) Sectioned prostates of TRP-SIY and C57BL/6-SIY mice were stained for PD-L1, visualized with peroxidase staining (brown), and counterstained with eosin (red). Arrows indicate areas of positive staining. Scale bars, 100 µm.
FIGURE 2
FIGURE 2
Modulation of the PD-1/PD-L1 interaction between 2C T cells and prostate or BMDCs does not affect T cell activity. (A) Naive 2C T cells were transferred into PD-L1+/ or PD-L1−/− TRP-SIY mice, along with intranasal infection with WSN-SIY virus. On day 14, 2C T cells were harvested from prostate tissue, stimulated with SIY peptide, and analyzed for IFN-γ expression. CD8 versus Thy1.1 plots were gated on all live cells from prostate. IFN-γ versus Thy1.1 plots were gated on CD8+ Thy1.1+ cells. Representative FACS plots from three experiments are shown. (B) Experimental scheme for analyzing BMDC-mediated delay of tolerance induction and refunctionalization of tolerized 2C cells in the prostate of TRP-SIY mice. On day 0, naive 2C T cells were adoptively transferred into TRP-SIY mice and given intranasal infection with WSN-SIY virus. On day 7 or 30, mice were injected intraprostatically with PBS or 1 × 10⁶ ex vivo matured SIY-loaded wild-type (WT) or PD-L1−/− BMDCs. At 6–7 d later, 2C T cells were harvested from prostate tissue, stimulated with SIY peptide and analyzed for IFN-γ expression. (C) Representative plots of flow cytometry analyses of cells from prostate tissues of mice that were injected with PBS, wild type (WT), or PD-L1−/− BMDCs on either day 7 or day 30 after initial 2C cell transfer. 2C TCR versus Thy1.1 plots were gated on all live cells from prostate. IFN-γ versus Thy1.1 staining was gated on 2C TCR+ Thy1.1+ cells. The numbers indicate percentage of IFNγ+ cells. (D and E) Percentages (mean ± SD) of IFN-γ+ 2C cells from three independent experiments normalized to PBS control. Number of mice for each treatment are indicated. *p < 0.05 comparing DC versus PBS injection. (F and G) Number of 2C TCR+Thy1.1+ cells from prostates injected with PBS, WT, or PD-L1−/− BMDCs either 7 d (F) or 30 d (G) after T cell transfer and analyzed after 6 d (F) or 7 d (G) later. Graphs are from three independent experiments, with at least four mice per group. NS, Compared with PBS control.
FIGURE 3
FIGURE 3
BMDCs act directly on 2C T cells in the prostate tissue. (A) TRP-SIY mice were injected intraprostatically with PBS-or SIY-loaded wild-type (WT) BMDCs on either day 7 or day 30 after initial 2C cell transfer and infection. At 6–7 d later, Thy1.1CD8+ T cells were harvested from prostate tissue and analyzed for IFN-γ expression. IFN-γ versus CD8 plots were gated on live CD8+ Thy1.1 cells. The numbers indicate percentage of IFN-γ+ cells. (B) TRP-SIY mice were injected with PBS or WT-DCs in the prostate. At 6 d later, prostate tissues were dissociated, and single-cell suspensions were stained with CD11c and CD80, CD86, CD70, 4-1BBL (black line), or isotype control (filled gray line). Histograms are gated on live CD11c+ cells. (C) TRP-SIY mice were injected with PBS-or SIY-loaded WT BMDCs on either day 7 or day 30 after initial 2C cell transfer and infection. At 6–7 d later, Thy1.1+ 2C T cells were harvested from prostate tissue, stimulated with SIY peptide, and analyzed for IL-2 expression. IFN-γ versus Thy1.1 flow cytometry plots were gated on live 2C TCR+ Thy1.1+ cells. The numbers indicate percentage of IL-2+ cells. (D) 2C T cells recovered from the prostates of TRP-SIY were assayed for CD44 expression 13 d post transfer and infection with WSN-SIY virus. Histograms are gated on Thy1.1+2C TCR+ T cells with either CD44 (black line) or isotype (filled gray line) and representative of three independent experiments. (E) TRP-SIY mice were injected with PBS, SIY peptide, or LPS-activated wild type (WT) BMDCs not pulsed with SIY peptide 7 d after initial 2C cell transfer and infection. At 6 d later, Thy1.1+ 2C T cells were harvested from prostate tissue, stimulated with SIY peptide, and analyzed for IFN-γ expression. IFN-γ versus Thy1.1 flow cytometry plots were gated on live 2C TCR+ Thy1.1+ cells. The numbers indicate percentage of IFNγ+ cells.
FIGURE 4
FIGURE 4
CD80 and CD86 expression on BMDCs is necessary for 2C T cell reactivation, but not the delay of 2C T cell tolerance. (A) Day 7 LPS-activated BMDCs were stained with anti-CD11c, -CD80, or -CD86 Abs (black line) or isotype control (filled gray line). CD80 and CD86 expression histograms are gated on CD11c+ cells. (B and C) Mice were treated and cells analyzed as in Fig. 2B, with prostate tissues injected with PBS, wild-type (WT), CD80−/−, CD86−/−, or CD80−/−CD86−/− BMDCs on either (B) day 7 or (C) day 30 after initial 2C cell transfer and infection. Percentages (mean ± SD) of IFN-γ+ 2C cells from at least three independent experiments are normalized to PBS control. Number of mice for each treatment is indicated. *p < 0.05, comparing DC with PBS injection, #p < 0.05 comparing WT with knockout DCs, §p < 0.05 comparing CD80−/−CD86−/− DCs with CD80−/− DCs. (D) At 30 d post 2C cell transfer and infection, TRP-SIY mice were injected intraprostatically with PBS, or SIY-loaded WT, CD80−/−, CD80−/−/CD86−/− BMDCs. On day 36, mice were injected retro-orbitally with a 1:1 mixture of SIY-pulsed (CFSEHi) and unpulsed (CFSELo) activated T cells (Thy1.1+). The following day, the proportions of CFSEHi versus CFSELo target cells were determined by flow cytometry. CFSE histograms are shown for live Thy1.1+ cells. Numbers indicate percentage of CFSE+ cells. Representative data from one of the two experiments are shown.
FIGURE 5
FIGURE 5
CD70 is required for DC-mediated delay in 2C T cell tolerance. (A) Day 7 LPS-activated BMDCs were stained for CD11c plus CD70, 4-1BBL (black line), or isotype control (filled gray line). Histograms are gated on CD11c+ cells. (B) F(ab'′)2 fragments are confirmed to maintain their Ag-binding capacity using a competition assay. BMDCs were incubated with 10 µg/ml of fluorescently labeled full-length Ab in the presence of the same amount of either F(ab'′)2 of interest or control anti-FcR F(ab '′)2 fragment. The cells were then stained with anti-CD11c and analyzed by flow cytometry. Center histogram shows binding of fluorescently labeled anti-CD70 to BMDCs in the presence of either anti-CD70 F(ab'′ )2 (gray) or control anti-FcR F(ab'′)2(black). Left histogram shows binding of fluorescently labeled anti-CD16/CD32 to BMDCs in the presence of either anti-FcR F(ab'′)2 (gray) or control anti-CD70 F(ab'′ )2(black). Right histogram shows binding of fluorescently labeled anti– 4-1BBL to BMDCs in the presence of either anti–4-1BBL F(ab'′)2 (gray) or control anti-FcR F(ab'′)2 (black). Histograms are gated on CD11c+ cells. (C) Experiments were conducted as in Fig. 2B with SIY-pulsed BMDCs incubated with anti-FcR, CD70, or 4-1BBL F(ab'′)2 fragments. Shown are percentages (mean ± SD) of IFN-γ+ 2C cells from three independent experiments normalized to PBS control. Number of mice for each treatment is indicated. (D) As in (C), except BMDCs were injected on day 30 post T cell transfer, and analysis was carried out on day 37. Shown are percentages (mean ± SD) of IFN-γ+ 2C cells from three independent experiments normalized to PBS control. Number of mice for each treatment is indicated. *p < 0.05 comparing DC with PBS injection, #p < 0.05 comparing BMDCs treated with anti-CD70 F(ab'′)2 and those treated with anti-FcR F(ab'′)2. (E) Day 7 LPS-matured BMDCs were labeled with CFSE and incubated with F(ab'′)2 fragments specific for FcR or CD70. DCs (10 × 103 per mouse) were surgically injected into one of the dorsal prostate lobes. At 3 and 5 d later, mice were sacrificed, and CSFE+ DCs in each of the prostate tissues were assessed by flow cytometry. Shown are the average numbers of DCs (±SD) from three prostates per group, per time point.
FIGURE 6
FIGURE 6
CD27 expression is progressively lost on TRP-SY prostate resident 2C T cells. (A) Naive 2C T cells pooled from spleens and lymph nodes were assayed for expression of CD28, 4-1BB, and CD27. Histograms are gated on Thy1.1+ 2C TCR+ cells stained with isotype Ab (shaded gray) or specific Ab (black line). (B) Naive Thy1.1+ 2C T cells were retro-orbitally injected into TRP-SIY mice, along with intranasal infection with WSN-SIY virus. Mice were sacrificed 13 (bold black line), 23 (gray line), and 36 (thin black line) d post transfer, and CD28, 4-1BB, and CD27 expression on prostate resident 2C T cells was assayed by flow cytometry. Histograms are gated on live 2C TCR+ Thy1.1+ cells with isotype Ab (shaded gray) or specific Ab (black line). (C) Mean fluorescence intensity of CD28, CD27, or 4-1BB staining from Thy1.1+2C TCR+T cells from naive mice or recovered from prostates at indicated times post transfer and WSN-SIY infection. Data shown are from at least two independent experiments (mean ± SD). (D) Time course of CD27 expression on 2C T cells recovered from TRAMP and C57BL/6 (B6) prostates 13 (bold black line), 23 (gray line), and 36 (thin black line) d post transfer. (E) As above, with 2C transfer/WSN-SIY infection and analysis of CD27 on 2C TCR+Thy1.1+ 2C T cells 13 (bold black line), 23 (gray line), and 36 (thin black line) d post transfer in spleens from TRP-SIY, TRAMP, and B6 mice.

References

    1. Rosenberg SA, Restifo NP, Yang JC, Morgan RA, Dudley ME. Adoptive cell transfer: a clinical path to effective cancer immunotherapy. Nat Rev Cancer. 2008;8:299–308. - PMC - PubMed
    1. Gulley JL, Drake CG. Immunotherapy for prostate cancer: recent advances, lessons learned, and areas for further research. Clin Cancer Res. 2011;17:3884–3891. - PMC - PubMed
    1. Sharpe AH. Mechanisms of costimulation. Immunol Rev. 2009;229:5–11. - PMC - PubMed
    1. Fife BT, Bluestone JA. Control of peripheral T-cell tolerance and autoimmunity via the CTLA-4 and PD-1 pathways. Immunol Rev. 2008;224:166–182. - PubMed
    1. Pilon-Thomas S, Mackay A, Vohra N, Mule JJ. Blockade of programmed death ligand 1 enhances the therapeutic efficacy of combination immunotherapy against melanoma. J Immunol. 2010;184:3442–3449. - PMC - PubMed

Publication types

MeSH terms