. 2012 Sep;181(3):1017-33.
doi: 10.1016/j.ajpath.2012.05.026. Epub 2012 Jul 15.

Progression to adrenocortical tumorigenesis in mice and humans through insulin-like growth factor 2 and β-catenin

Affiliations

Progression to adrenocortical tumorigenesis in mice and humans through insulin-like growth factor 2 and β-catenin

Joanne H Heaton et al. Am J Pathol. 2012 Sep.

Abstract

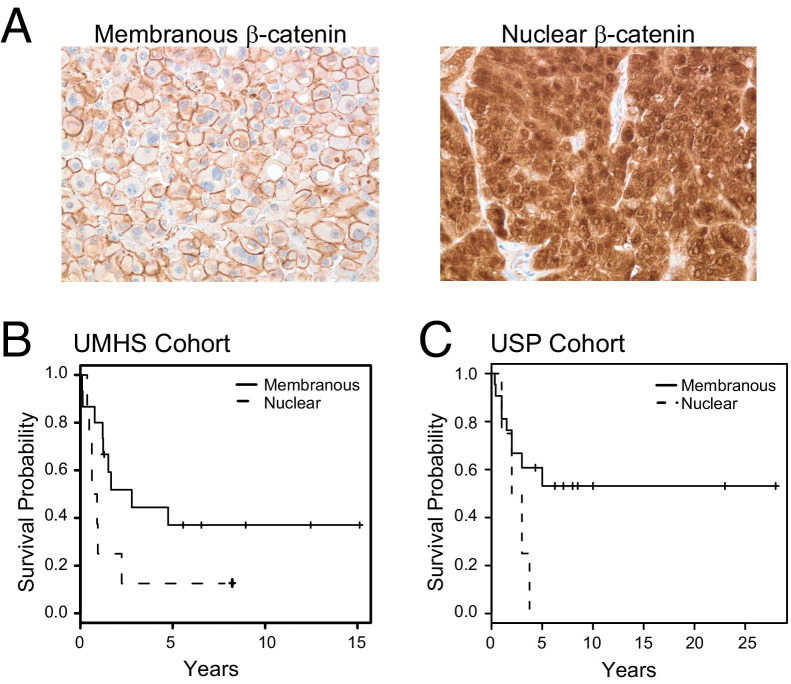
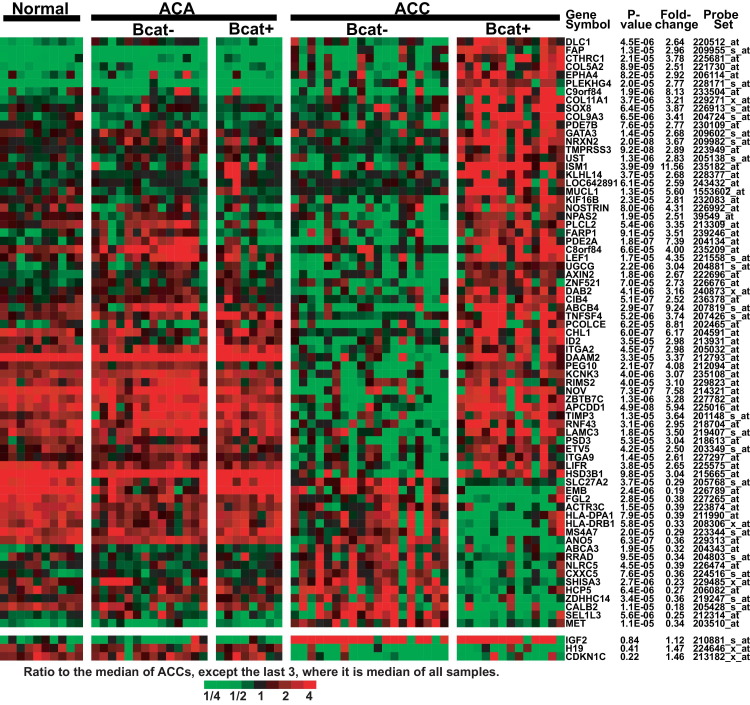
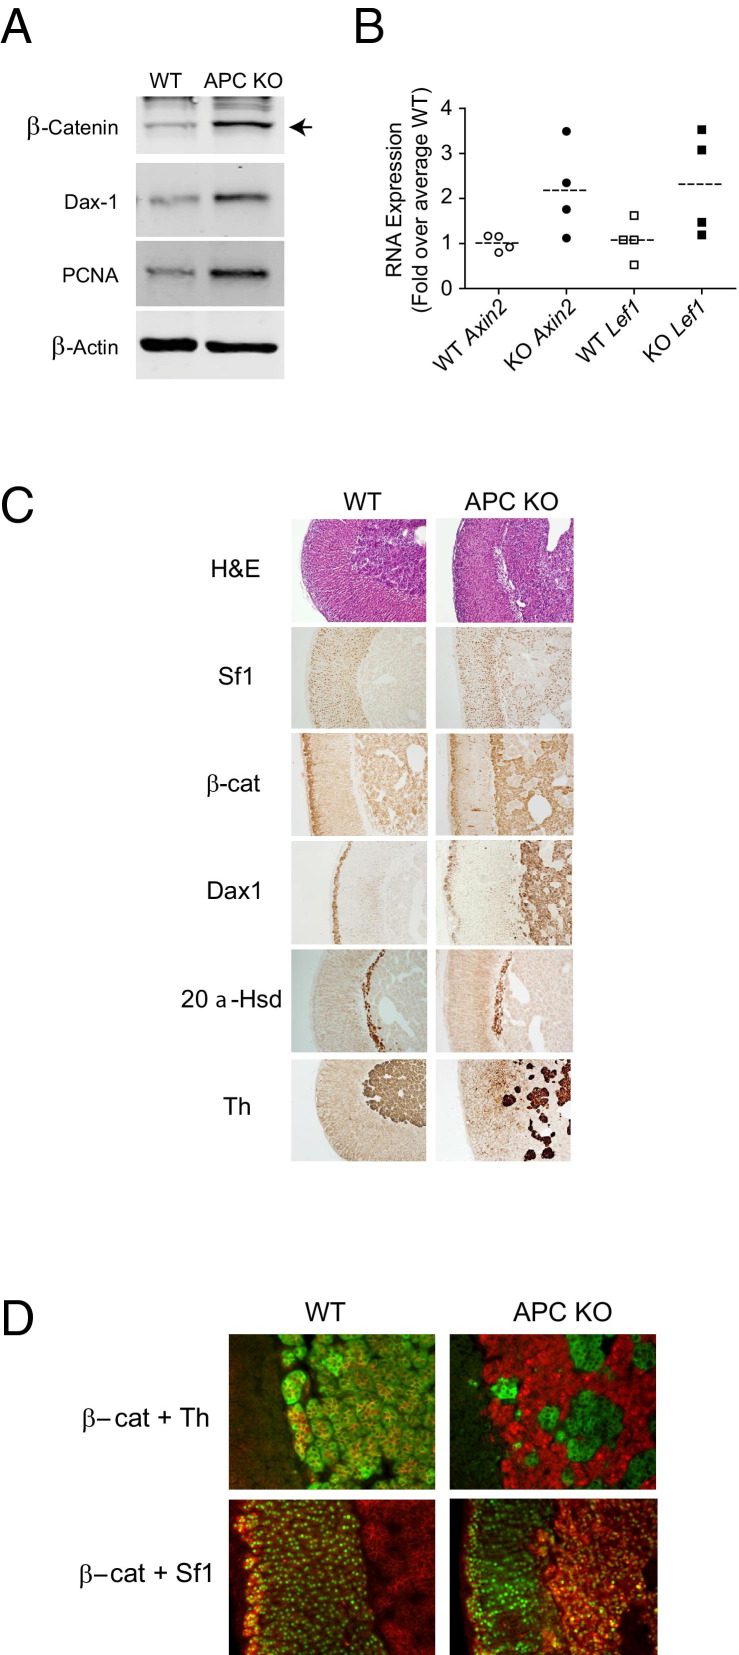
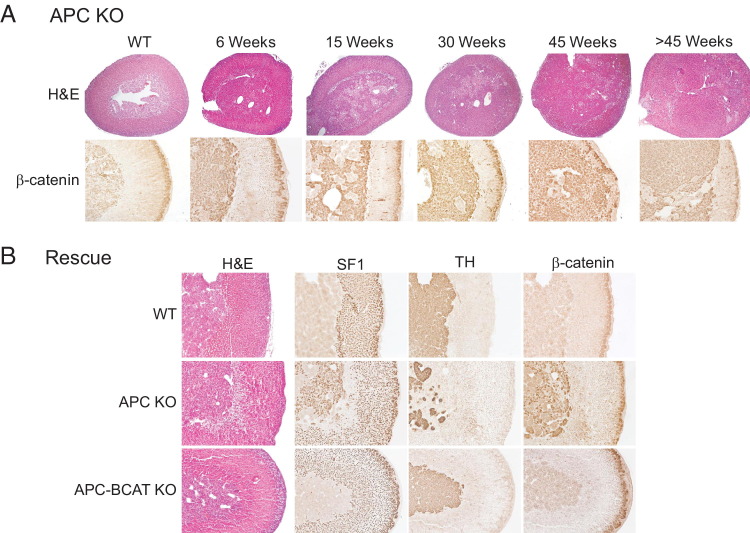
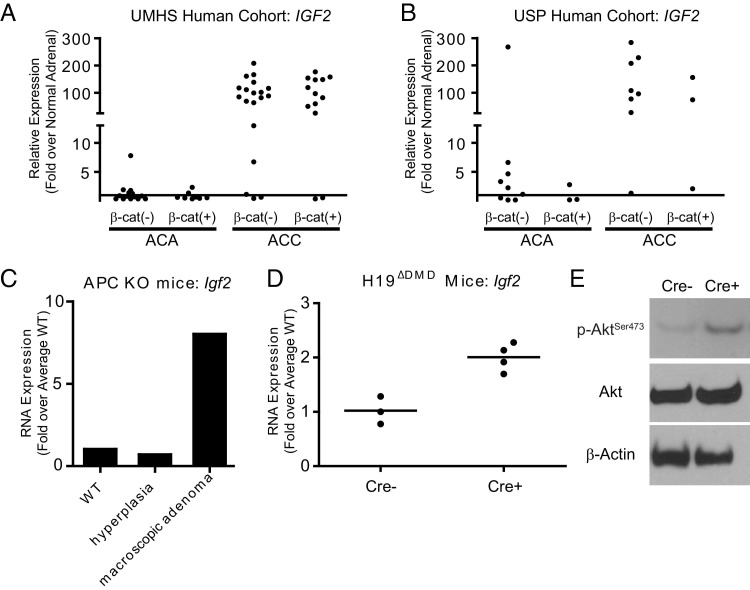
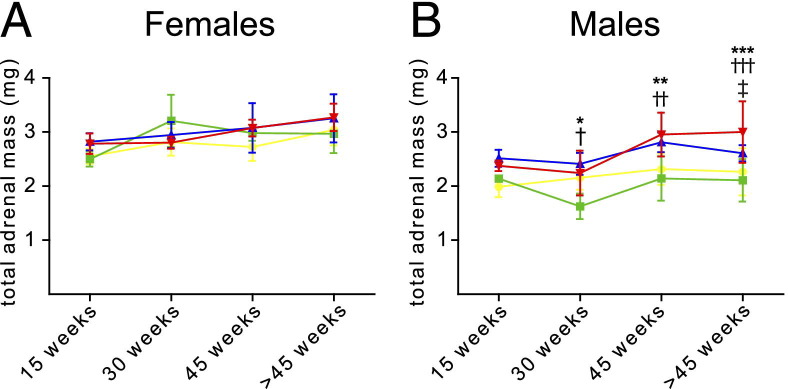
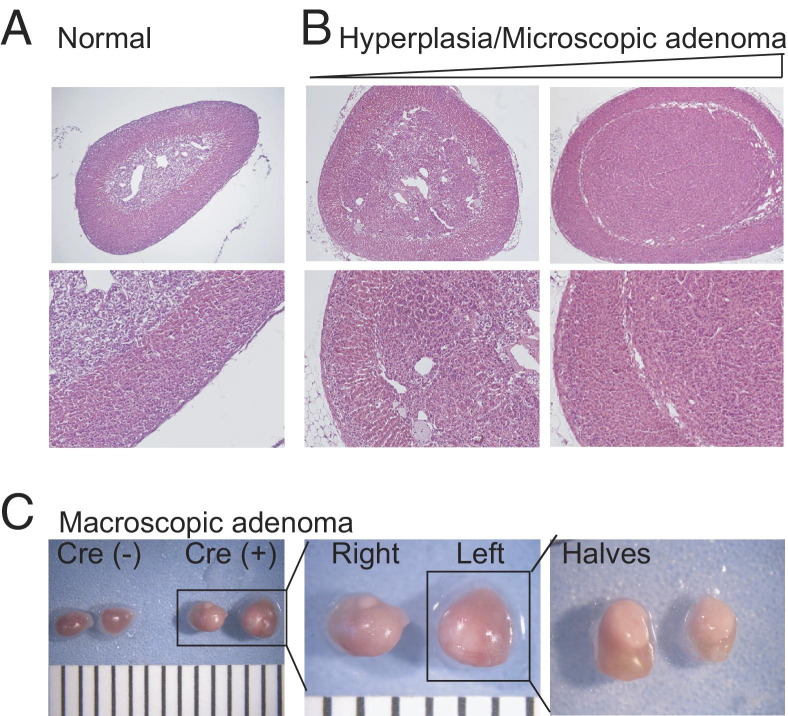
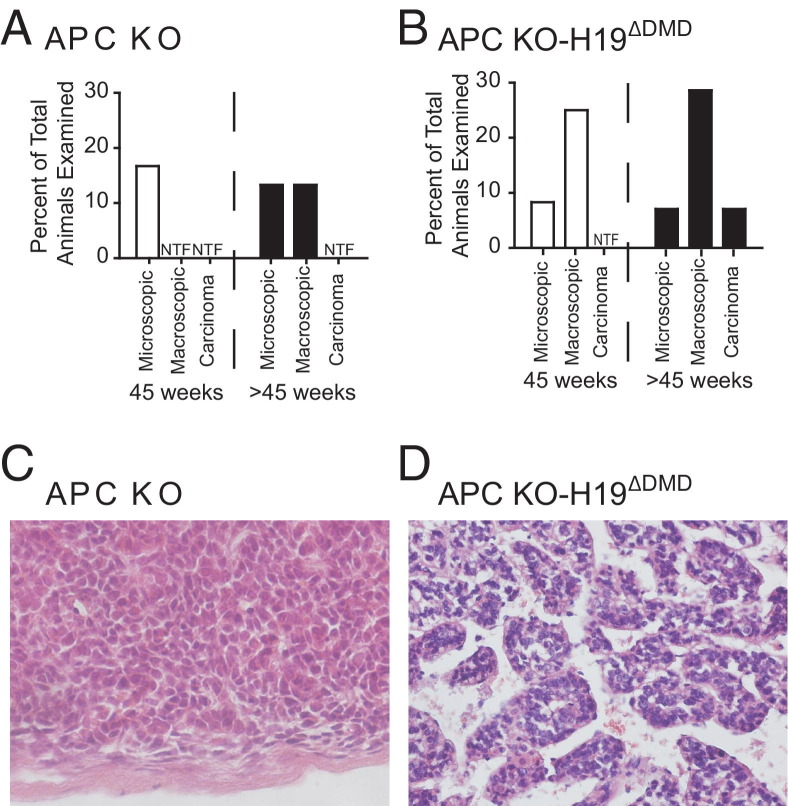
Dysregulation of the WNT and insulin-like growth factor 2 (IGF2) signaling pathways has been implicated in sporadic and syndromic forms of adrenocortical carcinoma (ACC). Abnormal β-catenin staining and CTNNB1 mutations are reported to be common in both adrenocortical adenoma and ACC, whereas elevated IGF2 expression is associated primarily with ACC. To better understand the contribution of these pathways in the tumorigenesis of ACC, we examined clinicopathological and molecular data and used mouse models. Evaluation of adrenal tumors from 118 adult patients demonstrated an increase in CTNNB1 mutations and abnormal β-catenin accumulation in both adrenocortical adenoma and ACC. In ACC, these features were adversely associated with survival. Mice with stabilized β-catenin exhibited a temporal progression of increased adrenocortical hyperplasia, with subsequent microscopic and macroscopic adenoma formation. Elevated Igf2 expression alone did not cause hyperplasia. With the combination of stabilized β-catenin and elevated Igf2 expression, adrenal glands were larger, displayed earlier onset of hyperplasia, and developed more frequent macroscopic adenomas (as well as one carcinoma). Our results are consistent with a model in which dysregulation of one pathway may result in adrenal hyperplasia, but accumulation of a second or multiple alterations is necessary for tumorigenesis.


Figures

Figure 1
Figure 1
Abnormal β-catenin localization correlates with poor prognosis in humans. A: Immunohistochemistry in ACC showing typical membranous β-catenin or nuclear β-catenin. B: Kaplan-Meier analysis of the UMHS cohort indicated that patients with membranous β-catenin staining (n = 15) had a better survival rate than those with nuclear β-catenin staining (n = 8; P = 0.06 log-rank test). C: Kaplan-Meier analysis of the USP cohort indicated that patients with membranous β-catenin staining (n = 22) had a better survival rate than those with nuclear β-catenin staining (n = 5; P = 0.09 log-rank test).
Figure 2
Figure 2
Gene expression differences between ACCs with normal membranous β-catenin (Bcat) versus cytoplasmic/nuclear β-catenin staining (Bcat+). An analysis of variance model fit to the five groups (normal, ACC Bcat+, ACC Bcat, ACA Bcat+, and ACA Bcat) was used to compare Bcat+ versus Bcat ACCs. Probe sets that yielded P < 0.0001 and an average fold change of at least 2.5 were selected, and reduced to those annotated with Entrez gene identifiers. Only the probe set with the smallest P value for a gene is shown. Bcat+ ACAs were those with either β-catenin nuclear staining or mutation of β-catenin exon 3. Data are expressed as the ratio to the median of ACCs, except that in the last three rows the median is for all samples. Red indicates the highest expression (ratio 4) and green indicates the lowest expression (ratio 1/4).
Figure 3
Figure 3
Conditional knock out of Apc in mice results in an increase in activated β-catenin and aberrant expression of cortical markers. A: Immunoblot analysis of whole adrenal protein lysates from 15-week-old WT (Cre controls) or APC KO mice. Whole adrenal lysates were prepared from individual mice, and immunoblot analysis was performed using 10 μg protein. Membranes were probed with antibodies against β-catenin, PCNA, and Dax1, with β-actin as a loading control. Blots shown are representative of four replicates (four different mice of each genotype) with similar results. B: Analysis of mRNA expression from 15-week-old WT and APC KO mice. Total RNA from whole adrenal glands was evaluated by qPCR for expression of the β-catenin downstream targets Axin2 and Lef1 in both WT (n = 4) and APC KO mice (n = 4). Individual data points represent expression in individual adrenal glands; dashed lines represent the mean of all adrenal glands evaluated for a given genotype. The mean WT levels were set equal to 1, and expression was normalized to β-actin. Levels of both Axin2 and Lef1 were elevated approximately twofold in APC KO mice (P = 0.018 and P = 0.042, respectively, one-tailed t-test on ΔΔCT). C: Histological comparison of adrenal glands from 15-week-old WT or APC KO mice. Tissue sections were subjected to H&E staining or to IHC. Representative sections are shown. D: Immunofluorescent costaining with β-catenin (red) and TH (green) or β-catenin (red) and Sf1 (green). Cells staining red with green nuclei are Sf1-expressing cells with cytoplasmic β-catenin, and those with yellow nuclei are Sf1-expressing cells with nuclear β-catenin. Original magnification: ×100 (C); ×200 (D).
Figure 4
Figure 4
Conditional knock out of Apc in mice leads to β-catenin-dependent adrenal hyperplasia and adenomas. A: Histological analysis and immunohistochemical staining for β-catenin in adrenal glands from a 30-week-old WT mouse and from APC KO mice at 6, 15, 30, 45, and >45 weeks of age. APC KO mice exhibit adrenal hyperplasia that increases with age and some develop adenomas at later ages. Abnormal β-catenin expression is evident primarily in the inner region of the gland, although a few aberrant cells appear throughout the cortex. B: Rescue of APC KO phenotype. Adrenal glands were harvested from 6-week-old WT, APC KO, and APC-BCAT KO mice. H&E staining and IHC for Sf1, TH, and β-catenin were performed. Adrenals from APC-BCAT KO mice display staining characteristics similar to those of WT mice and unlike those of APC KO mice. Original magnification: ×40 (A, H&E); ×100 (A, β-catenin; B).
Figure 5
Figure 5
IGF2 and Igf2 expression is elevated in human ACCs and in mice with conditional knock out of the Igf2/H19 DMD. IGF2 levels were evaluated in human samples from ACA and ACC using microarray data from the UMHS cohort (GEO series GSE33371; individual tumor samples assessed relative to an average of 10 normal samples) (A) and by qPCR of individual human samples from the USP cohort (individual tumor samples assessed relative to 61 normal samples) (B). IGF2 levels were dramatically elevated in ACCs in both cohorts. No association of β-catenin status with IGF2 levels was detected in either ACAs or ACCs. C: qPCR determination of Igf2 levels in adrenals from one Cre control mouse (WT), one APC KO with hyperplasia, and one APC KO with a large macroscopic adenoma. Igf2 mRNA was elevated dramatically in the macroscopic adenoma. D: qPCR determination of Igf2 levels in Cre control mice (n = 3) and in H19ΔDMD mice (Cre+; n = 4). Igf2 levels were elevated approximately twofold in H19ΔDMD mice (P = 0.005, one-tailed t-test on ΔΔCT). Horizontal bars represent the mean value of each group. E: Whole adrenal gland lysates were analyzed by immunoblotting for phosphorylated Akt at Ser473 and total Akt, with β-actin as a loading control. Elevated levels of p-Akt in H19ΔDMD (Cre+) mice, relative to that in Cre mice, indicate activation of Igf2 signaling. Blots shown are representative of four replicates (four different mice of each genotype) with similar results.
Figure 6
Figure 6
Total adrenal mass increases more rapidly in APC KO-H19ΔDMD mice, compared with APC KO mice. Adrenal glands were harvested from mice of the indicated ages and weighed individually. The sum of the two adrenal gland masses for each mouse was measured and fit to an analysis of variance model with separate means for 32 groups of mice, defined by four age groups (15, 30, 45, and >45 weeks), the two sexes, and four genetic classes: H19DDMD (green), APC KO (blue), APC KO-H19DDMD (red), and control (yellow). Pairs of groups were compared with F tests for pairwise contrasts. Female mice (A) exhibited no significant differences; in male mice (B), significant differences appeared from 30 weeks of age. Data are expressed as means ± SD. *P = 5.7 × 10⁻⁵, **P = 7.9 × 10⁻⁵, and ***P = 0.012 APC KO versus H19ΔDMD; P = 0.0023, ††P = 4.5 × 10⁻⁷, and †††P = 6.7 × 10⁻⁸ APC KO-H19ΔDMD versus H19ΔDMD; and P = 0.040 APC KO versus APC KO-H19ΔDMD.
Figure 7
Figure 7
Combined loss of Apc and loss of imprinting at the DMD of the Igf2/H19 region results in tumor formation in mice. Images (H&E) shown are representative of normal adrenal glands from a 45-week-old normal mouse (A) and a 60-week-old APC KO mouse demonstrating hyperplasia to adenoma formation (B). C: Macroscopic adenomas were also found in APC KO and APC KO-H19ΔDMD mice. Gross anatomy of adrenal glands from 45-week-old WT (Cre) and APC KO-H19ΔDMD (Cre+) mice are shown. For scale (C), black lines are spaced 1 mm apart. Original magnification: ×40 (A, upper row); ×100 (A, lower row).
Figure 8
Figure 8
APC KO and APC KO-H19ΔDMD mice develop tumors of increased severity. A and B: Tumor types present in APC KO mice and APC KO-H19ΔDMD mice at 45 and >45 weeks of age. C: Adrenal (H&E) of a 48-week-old APC KO mouse. The APC KO mice exhibit some microscopic and macroscopic adenomas but no tumors with a Weiss score of >2. D: Adrenal (H&E) of a 55-week-old APC KO-H19ΔDMD mouse with adrenocortical carcinoma. H&E staining was performed on adrenal glands harvested from mice at 15, 30, 45, and >45 weeks of age. H&E-stained sections of all available adrenal glands from WT (Cre controls), H19ΔDMD, APC KO, and APC KO-H19ΔDMD mice were evaluated by a single pathologist (T.J.G.) and categorized as normal or as having hyperplasia, microscopic adenoma, macroscopic adenoma, or carcinoma. Representative images are shown in Figure 7, and the data are summarized in Table 6. Original magnification, ×200. NTF, no tumors found.

References

    1. Fassnacht M., Allolio B. Epidemiology of adrenocortical carcinoma. In: Hammer G.D., Else T., editors. Adrenocortical Carcinoma: Basic Science and Clinical Concepts. Springer; New York: 2011. pp. 23–30.
    1. Bilimoria K.Y., Shen W.T., Elaraj D., Bentrem D.J., Winchester D.J., Kebebew E., Sturgeon C. Adrenocortical carcinoma in the United States: treatment utilization and prognostic factors. Cancer. 2008;113:3130–3136. - PubMed
    1. Kirschner L.S. Emerging treatment strategies for adrenocortical carcinoma: a new hope. J Clin Endocrinol Metab. 2006;91:14–21. - PubMed
    1. Libé R., Fratticci A., Bertherat J. Adrenocortical cancer: pathophysiology and clinical management. Endocr Relat Cancer. 2007;14:13–28. - PubMed
    1. Bertherat J., Bertagna X. Pathogenesis of adrenocortical cancer. Best Pract Res Clin Endocrinol Metab. 2009;23:261–271. - PubMed

Publication types

MeSH terms

Substances