

Impact of FTO genotypes on BMI and weight in polycystic ovary syndrome: a systematic review and meta-analysis
- PMID: 22801903
- PMCID: PMC3433670
- DOI: 10.1007/s00125-012-2638-6
Impact of FTO genotypes on BMI and weight in polycystic ovary syndrome: a systematic review and meta-analysis
Erratum in
- Diabetologia. 2012 Oct;55(10):2858-9
Abstract
Aims/hypothesis: FTO gene single nucleotide polymorphisms (SNPs) have been shown to be associated with obesity-related traits and type 2 diabetes. Several small studies have suggested a greater than expected effect of the FTO rs9939609 SNP on weight in polycystic ovary syndrome (PCOS). We therefore aimed to examine the impact of FTO genotype on BMI and weight in PCOS.
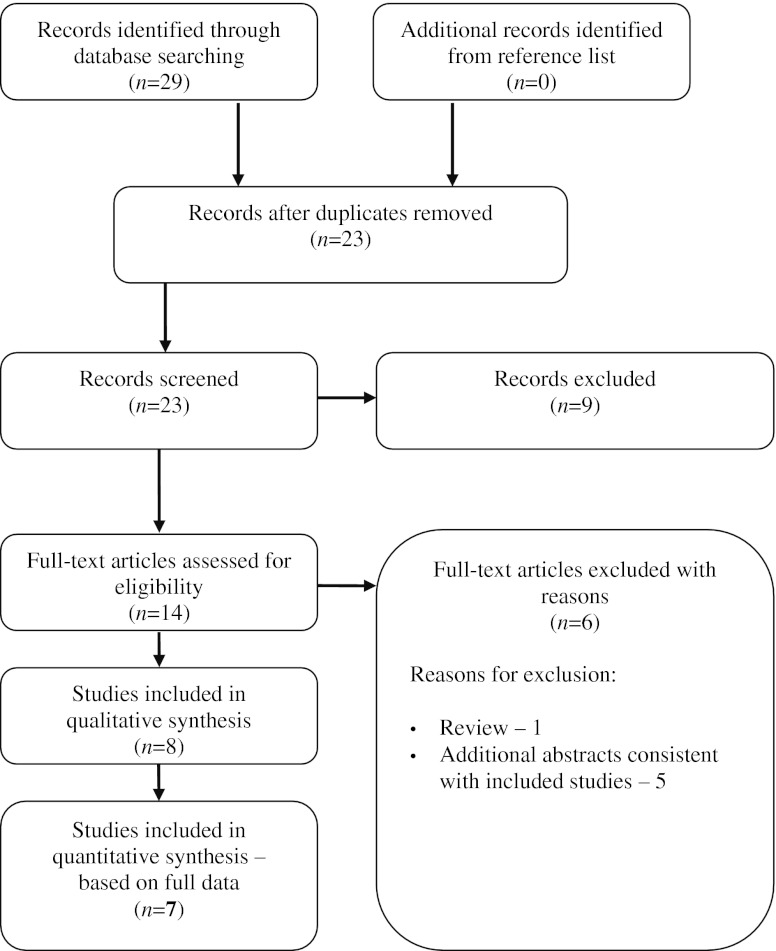
Methods: A systematic search of medical databases (PubMed, EMBASE and Cochrane CENTRAL) was conducted up to the end of April 2011. Seven studies describing eight distinct PCOS cohorts were retrieved; seven were genotyped for SNP rs9939609 and one for SNP rs1421085. The per allele effect on BMI and body weight increase was calculated and subjected to meta-analysis.
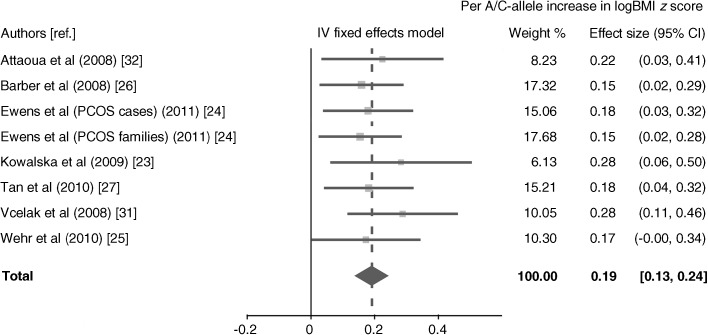
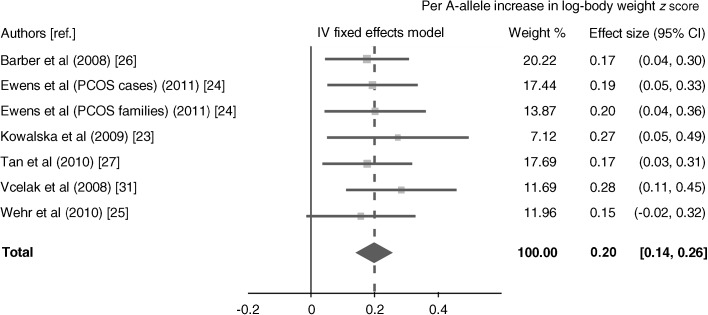
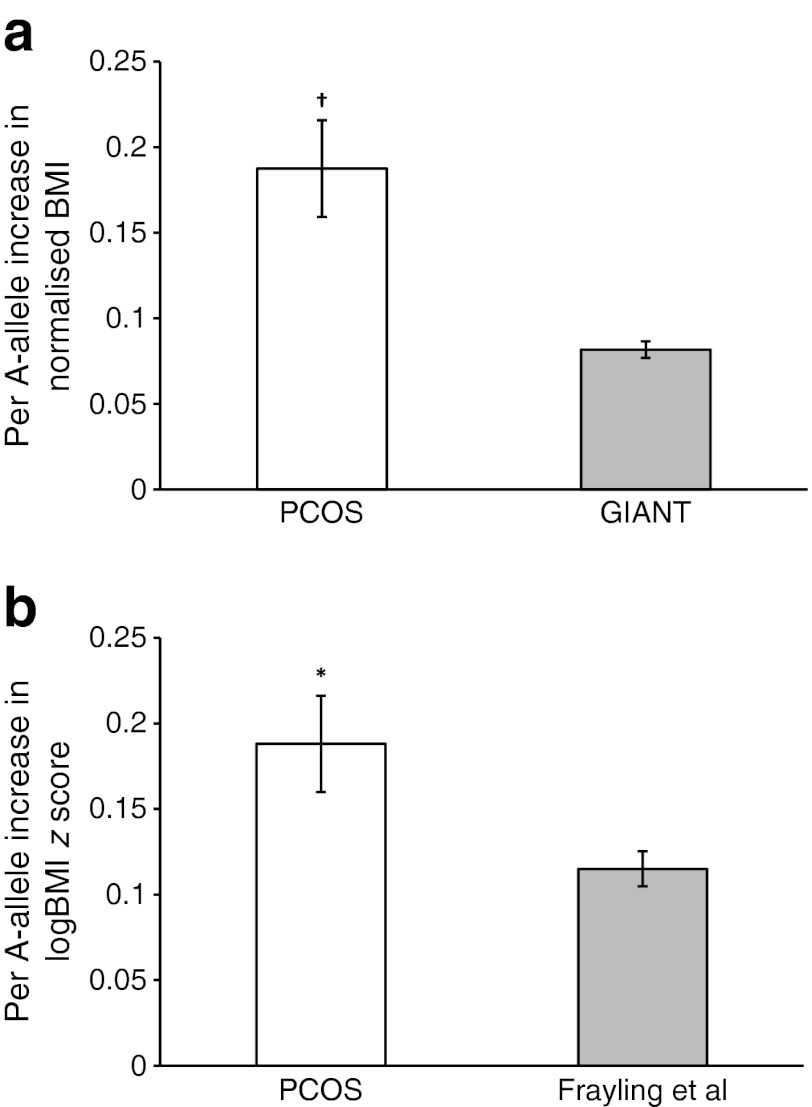
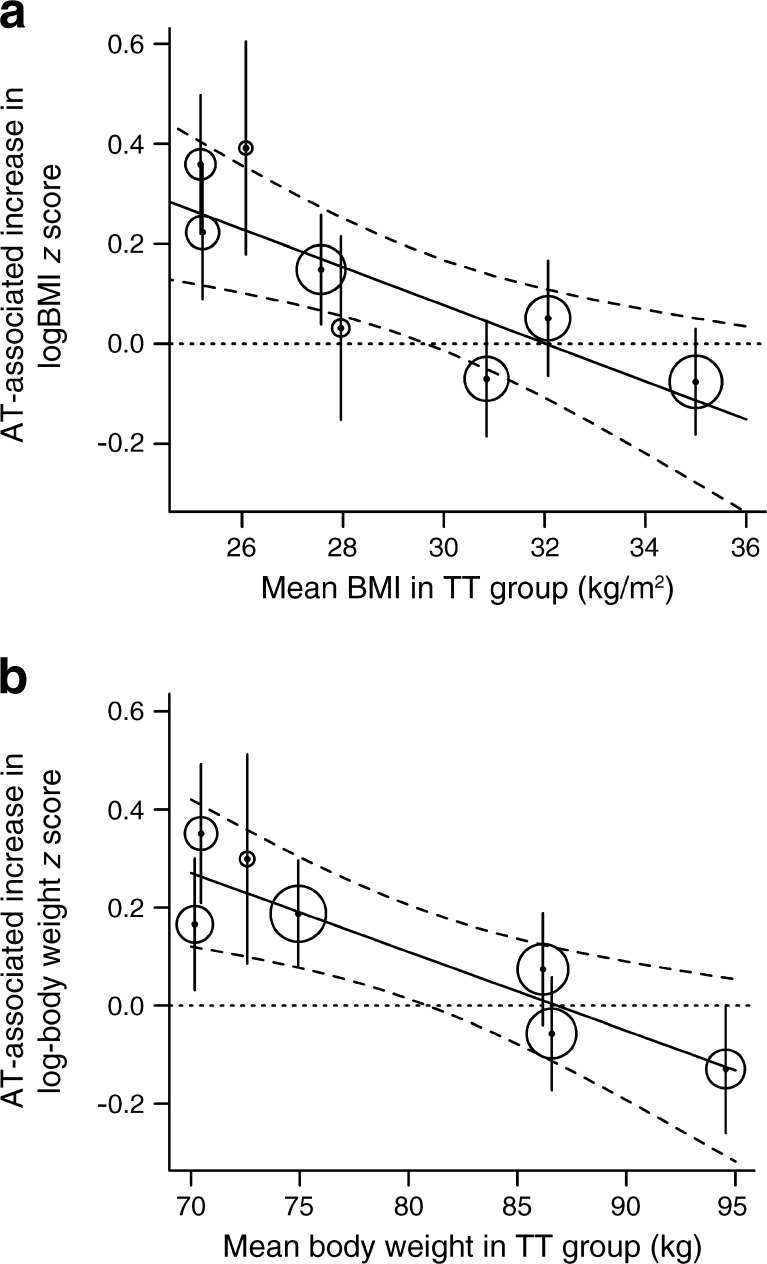
Results: A total of 2,548 women with PCOS were included in the study; 762 were TT homozygotes, 1,253 had an AT/CT genotype, and 533 were AA/CC homozygotes. Each additional copy of the effect allele (A/C) increased the BMI by a mean of 0.19 z score units (95% CI 0.13, 0.24; p = 2.26 × 10(-11)) and body weight by a mean of 0.20 z score units (95% CI 0.14, 0.26; p = 1.02 × 10(-10)). This translated into an approximately 3.3 kg/m(2) increase in BMI and an approximately 9.6 kg gain in body weight between TT and AA/CC homozygotes. The association between FTO genotypes and BMI was stronger in the cohorts with PCOS than in the general female populations from large genome-wide association studies. Deviation from an additive genetic model was observed in heavier populations.
Conclusions/interpretation: The effect of FTO SNPs on obesity-related traits in PCOS seems to be more than two times greater than the effect found in large population-based studies. This suggests an interaction between FTO and the metabolic context or polygenic background of PCOS.
Figures
Similar articles
-
Bidirectional Mendelian randomization to explore the causal relationships between body mass index and polycystic ovary syndrome.Hum Reprod. 2019 Jan 1;34(1):127-136. doi: 10.1093/humrep/dey343. Hum Reprod. 2019. PMID: 30496407 Free PMC article.
-
FTO genotype and weight loss in diet and lifestyle interventions: a systematic review and meta-analysis.Am J Clin Nutr. 2016 Apr;103(4):1162-70. doi: 10.3945/ajcn.115.123448. Epub 2016 Feb 17. Am J Clin Nutr. 2016. PMID: 26888713 Free PMC article.
-
Association between fat mass and obesity associated (FTO) gene rs9939609 A/T polymorphism and polycystic ovary syndrome: a systematic review and meta-analysis.BMC Med Genet. 2017 Aug 21;18(1):89. doi: 10.1186/s12881-017-0452-1. BMC Med Genet. 2017. PMID: 28826396 Free PMC article.
-
An association between fat mass and obesity-associated (FTO) (rs9939609) and kisspeptin-1 (KISS-1) (rs4889, rs372790354) gene polymorphisms with polycystic ovary syndrome: an updated meta-analysis and power analysis.J Assist Reprod Genet. 2024 Sep;41(9):2457-2475. doi: 10.1007/s10815-024-03213-7. Epub 2024 Aug 10. J Assist Reprod Genet. 2024. PMID: 39126595 Free PMC article.
-
Sertindole for schizophrenia.Cochrane Database Syst Rev. 2005 Jul 20;2005(3):CD001715. doi: 10.1002/14651858.CD001715.pub2. Cochrane Database Syst Rev. 2005. PMID: 16034864 Free PMC article.
Cited by
-
[Polycystic ovary syndrome as a gender-specific cardiometabolic risk factor].Inn Med (Heidelb). 2023 Jul;64(7):642-648. doi: 10.1007/s00108-023-01529-7. Epub 2023 Jun 8. Inn Med (Heidelb). 2023. PMID: 37291369 Review. German.
-
Differential Association of FTO Gene variants and Haplotypes with the Susceptibility to Polycystic Ovary Syndrome According To Obesity in Women with PCOS.Reprod Sci. 2023 Jul;30(7):2166-2176. doi: 10.1007/s43032-022-01149-w. Epub 2023 Jan 5. Reprod Sci. 2023. PMID: 36602653
-
EMR-linked GWAS study: investigation of variation landscape of loci for body mass index in children.Front Genet. 2013 Dec 3;4:268. doi: 10.3389/fgene.2013.00268. eCollection 2013. Front Genet. 2013. PMID: 24348519 Free PMC article.
-
Association between melatonin receptor gene polymorphisms and polycystic ovarian syndrome: a systematic review and meta-analysis.Biosci Rep. 2020 Jun 26;40(6):BSR20200824. doi: 10.1042/BSR20200824. Biosci Rep. 2020. PMID: 32463080 Free PMC article.
-
rs4889 polymorphism in KISS1 gene, its effect on polycystic ovary syndrome development and anthropometric and hormonal parameters in Saudi women.J Biomed Sci. 2018 May 30;25(1):50. doi: 10.1186/s12929-018-0452-2. J Biomed Sci. 2018. PMID: 29848339 Free PMC article.
References
-
- Finucane MM, Stevens GA, Cowan MJ, et al. National, regional, and global trends in body-mass index since 1980: systematic analysis of health examination surveys and epidemiological studies with 960 country-years and 9·1 million participants. Lancet. 2011;377:557–567. doi: 10.1016/S0140-6736(10)62037-5. - DOI - PMC - PubMed
Publication types
MeSH terms
Substances
Grants and funding
LinkOut - more resources
Full Text Sources
Other Literature Sources
Medical
Miscellaneous
