. 2013 Jan;18(1):11-23.
doi: 10.1007/s12192-012-0351-5. Epub 2012 Jul 18.

Gene regulatory network of unfolded protein response genes in endoplasmic reticulum stress

Affiliations

Gene regulatory network of unfolded protein response genes in endoplasmic reticulum stress

Sayuri Takayanagi et al. Cell Stress Chaperones. 2013 Jan.

Abstract

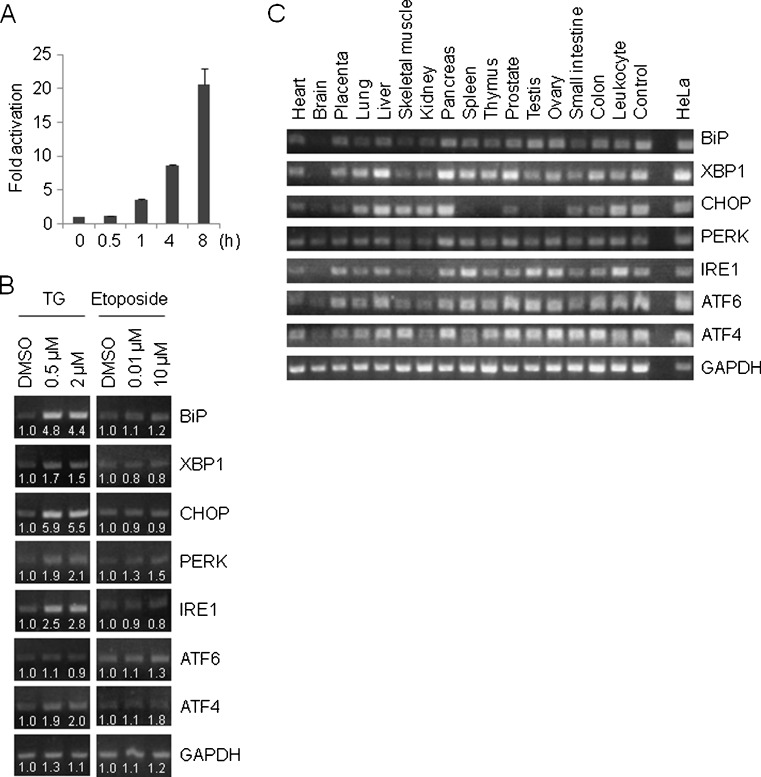
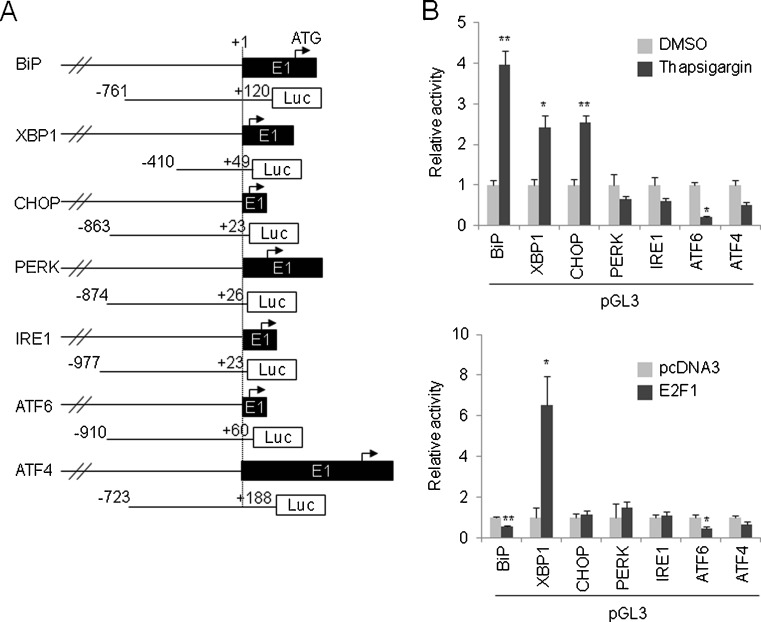
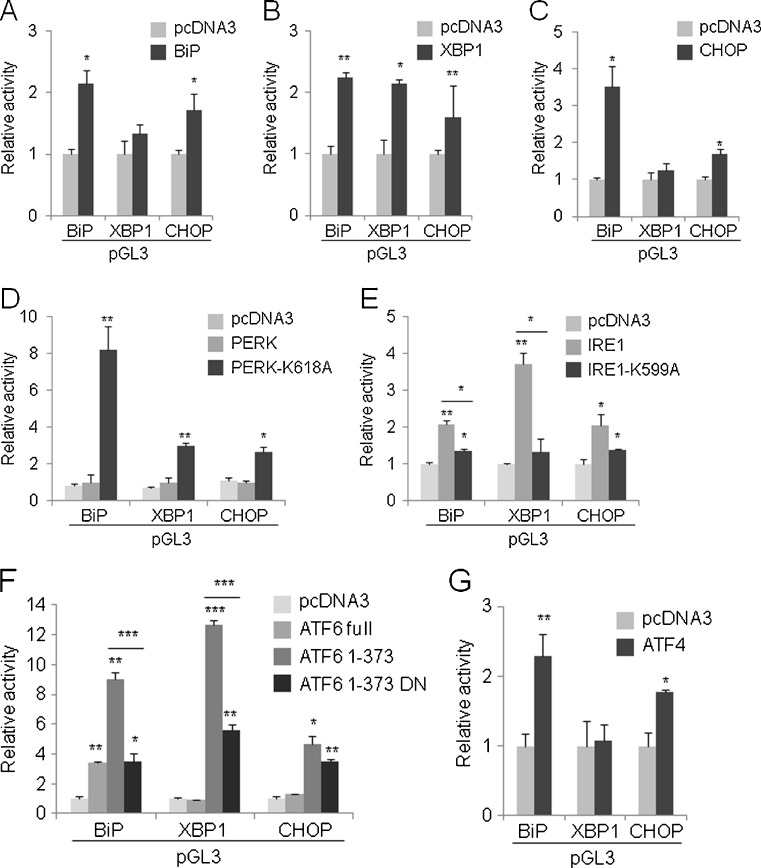
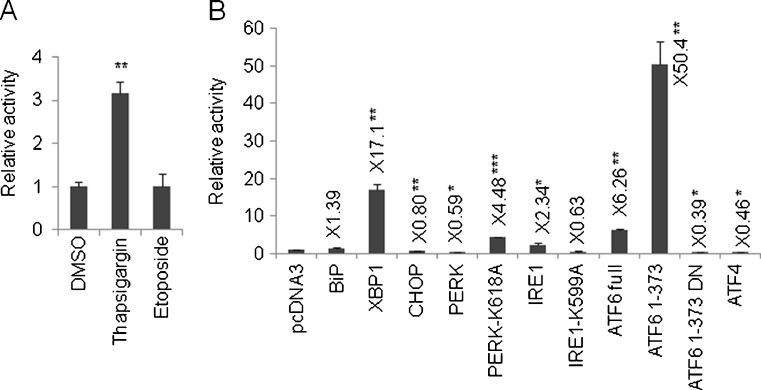
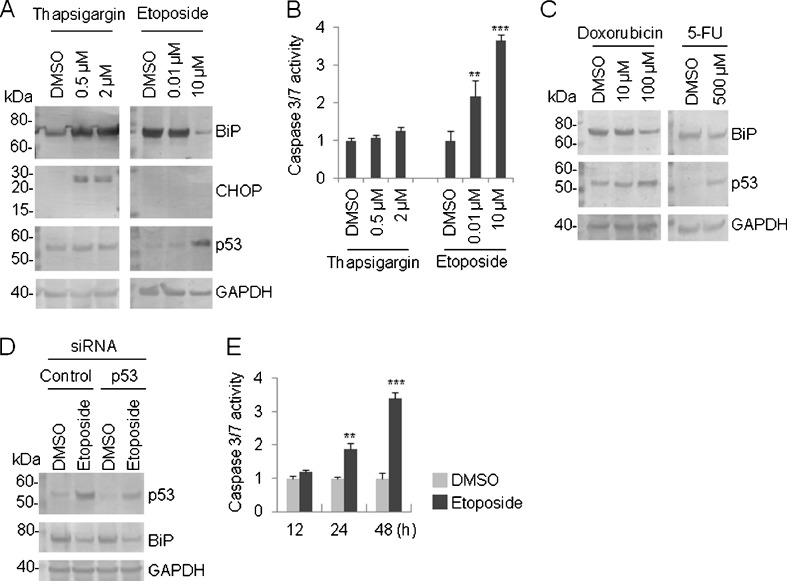
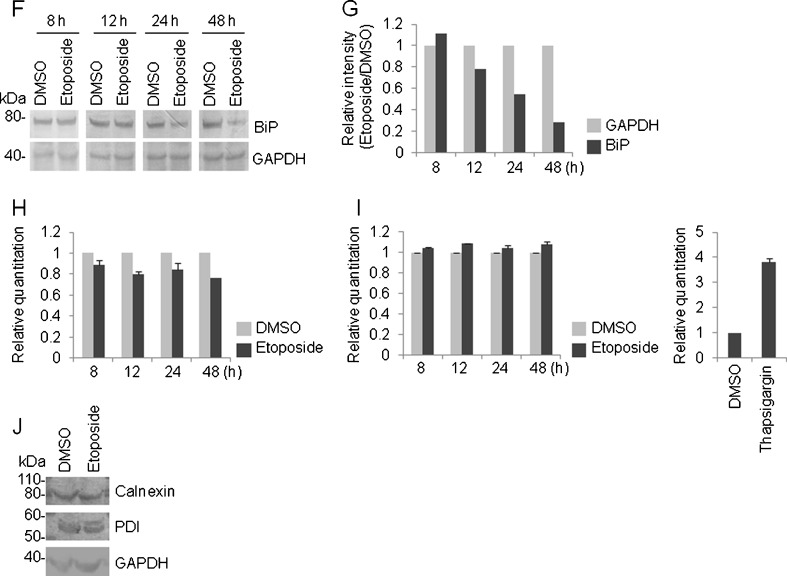
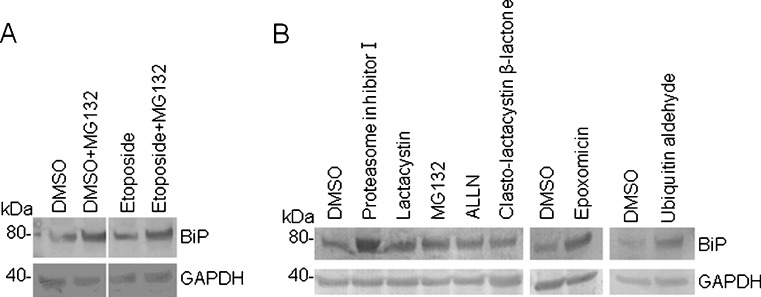
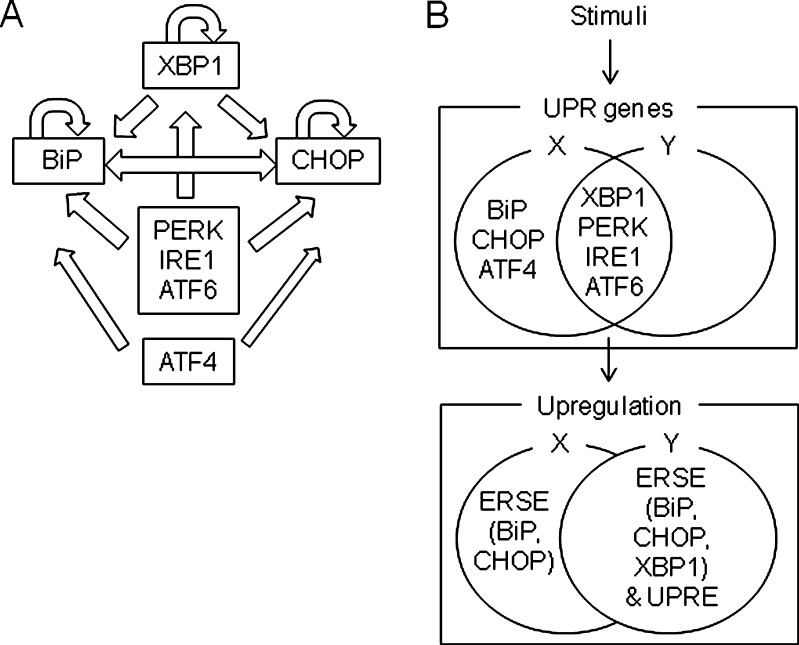
In the endoplasmic reticulum (ER), secretory and membrane proteins are properly folded and modified, and the failure of these processes leads to ER stress. At the same time, unfolded protein response (UPR) genes are activated to maintain homeostasis. Despite the thorough characterization of the individual gene regulation of UPR genes to date, further investigation of the mutual regulation among UPR genes is required to understand the complex mechanism underlying the ER stress response. In this study, we aimed to reveal a gene regulatory network formed by UPR genes, including immunoglobulin heavy chain-binding protein (BiP), X-box binding protein 1 (XBP1), C/EBP [CCAAT/enhancer-binding protein]-homologous protein (CHOP), PKR-like endoplasmic reticulum kinase (PERK), inositol-requiring 1 (IRE1), activating transcription factor 6 (ATF6), and ATF4. For this purpose, we focused on promoter-luciferase reporters for BiP, XBP1, and CHOP genes, which bear an ER stress response element (ERSE), and p5 × ATF6-GL3, which bears an unfolded protein response element (UPRE). We demonstrated that the luciferase activities of the BiP and CHOP promoters were upregulated by all the UPR genes, whereas those of the XBP1 promoter and p5 × ATF6-GL3 were upregulated by all the UPR genes except for BiP, CHOP, and ATF4 in HeLa cells. Therefore, an ERSE- and UPRE-centered gene regulatory network of UPR genes could be responsible for the robustness of the ER stress response. Finally, we revealed that BiP protein was degraded when cells were treated with DNA-damaging reagents, such as etoposide and doxorubicin; this finding suggests that the expression level of BiP is tightly regulated at the post-translational level, rather than at the transcriptional level, in the presence of DNA damage.


Figures

Fig. 1
Fig. 1
Transcriptional regulation of UPR genes. a Time-dependent expression changes of BiP mRNA were detected using quantitative RT-PCR in thapsigargin (0.5 μM)-treated HeLa cells. GADH was used as an internal standard. The values represent the mean ± standard deviation (n = 2). b The changes in the mRNA expression level for UPR genes were determined using semi-quantitative RT-PCR in thapsigargin (TG; 8 h)- or etoposide (48 h)-treated HeLa cells. The band intensity was calculated using Quantity One. c mRNA expression pattern of UPR genes in human tissues and organs. HeLa cDNA was used as a positive control (rightmost lane)
Fig. 2
Fig. 2
Promoter analysis of UPR genes. a Schematic of promoter region of UPR genes and pGL3-based promoter-luciferase reporters. Exon 1 (black box with E1), the translation initiation codon (arrow), the position (number) relative to the start point of transcription (dotted line, designated as +1), and the luciferase gene (Luc within white box) are indicated. b Responsiveness of promoter region of UPR genes toward thapsigargin (top) and E2F1 (bottom). The indicated luciferase reporters were introduced into the cells, and 24 h later, the cells were treated with thapsigargin (0.5 μM) for 8 h (top), or the indicated luciferase reporters were co-introduced into the cells with the E2F1 expression vector for 24 h (bottom) and the luciferase activity was then measured. In each panel, pGL3-basic was used as an internal standard. The values represent the mean ± standard deviation (n = 3; *P < 0.05; **P < 0.01)
Fig. 3
Fig. 3
Regulation of BiP, XBP1, and CHOP promoter by UPR genes. The expression vectors for the UPR genes were coexpressed with pGL3-BiP, pGL3-XBP1, or pGL3-CHOP for 24 h, and the luciferase activity was then measured. In each panel, pGL3-Basic was used as an internal standard. The values represent the mean ± standard deviation (n = 3; *P < 0.05; **P < 0.01; ***P < 0.001 versus pcDNA3). The asterisk above the line indicates a statistically significant difference between the below-the-line bar graph (e, f). a BiP, b spliced XBP1, c CHOP, d PERK and PERK-K618A, e IRE1 and IRE1-K599A, f ATF6 full-length, ATF6 1-373 and its dominant negative version (ATF6 1-373 DN), and g ATF4
Fig. 4
Fig. 4
Regulation of UPRE by UPR genes. a p5 × ATF6-GL3 was transfected into the cells and 24 h later, thapsigargin (0.5 μM, 8 h) or etoposide (10 μM, 48 h) was added and the luciferase activity was measured. b p5 × ATF6-GL3 was cotransfected with the indicated expression vectors for 24 h, and the luciferase activity was measured. In each panel, pGL3-Basic was used as an internal standard. Values represent the mean ± standard deviation (n = 3; *P < 0.05; **P < 0.01; ***P < 0.001 versus pcDNA3). In (b), the average of the relative activity compared with pcDNA3 was inserted near the appropriate bar graph
Fig. 5
Fig. 5
Alteration of BiP protein level in response to DNA damage. a HeLa cells were treated with the indicated concentration of thapsigargin (8 h) or etoposide (48 h), and a western blot analysis was performed using the indicated antibody. The position of the molecular marker (in kilodaltons) is indicated on the left side of the panel. b HeLa cells were treated with the indicated concentration of thapsigargin (8 h) or etoposide (48 h), and the caspase 3/7 activity was determined. The blank value was subtracted from the actual measured value. Values represent the mean ± standard deviation (n = 4; **P < 0.01; ***P < 0.001 versus DMSO). c HeLa cells were treated with the indicated concentration of doxorubicin or 5-FU for 48 h and a western blot analysis was performed using the indicated antibody. Left, the position of the molecular marker (in kilodaltons) is indicated. d Control or p53 siRNA was introduced into HeLa cells for two successive days and the cells were exposed to etoposide (10 μM) for 48 h; a western blot analysis was then performed using the indicated antibody. Left, the position of the molecular marker (in kilodaltons) is indicated. e HeLa cells were treated with etoposide (10 μM) for the indicated period, and a caspase 3/7 assay was performed to detect apoptosis. The blank value was subtracted from the actual measured value. Values represent the mean ± standard deviation (n = 4; **P < 0.01; ***P < 0.001 versus DMSO). f HeLa cells were treated with etoposide (10 μM) for the indicated period, and a western blot analysis was performed with the indicated antibody. Left, the position of the molecular marker (in kilodaltons) is indicated. g The blot image in (f) was processed using Quantity One. Briefly, each specific band was quantified by volume analysis using the background subtraction method and the resulting density was represented as the ratio of etoposide/DMSO. The resulting ratio was further normalized by the corresponding GAPDH band. h HeLa cells were treated with etoposide (10 μM) for the indicated period, and a TaqMan real-time RT-PCR was performed with the BiP primer. In each panel, GAPDH was used as an internal standard. Values represent the mean ± standard deviation (n = 2). i HeLa cells were treated with etoposide (10 μM) for the indicated period (left) and thapsigargin (0.5 μM) for 8 h (right), and a TaqMan real-time RT-PCR was performed with the XBP1 primer. In each panel, GAPDH was used as an internal standard. Values represent the mean ± standard deviation (n = 2). j HeLa cells were treated with etoposide (10 μM) for 48 h, and a western blot analysis was performed with the indicated antibody. Left, the position of the molecular marker (in kilodaltons) is indicated
Fig. 5
Fig. 5
Alteration of BiP protein level in response to DNA damage. a HeLa cells were treated with the indicated concentration of thapsigargin (8 h) or etoposide (48 h), and a western blot analysis was performed using the indicated antibody. The position of the molecular marker (in kilodaltons) is indicated on the left side of the panel. b HeLa cells were treated with the indicated concentration of thapsigargin (8 h) or etoposide (48 h), and the caspase 3/7 activity was determined. The blank value was subtracted from the actual measured value. Values represent the mean ± standard deviation (n = 4; **P < 0.01; ***P < 0.001 versus DMSO). c HeLa cells were treated with the indicated concentration of doxorubicin or 5-FU for 48 h and a western blot analysis was performed using the indicated antibody. Left, the position of the molecular marker (in kilodaltons) is indicated. d Control or p53 siRNA was introduced into HeLa cells for two successive days and the cells were exposed to etoposide (10 μM) for 48 h; a western blot analysis was then performed using the indicated antibody. Left, the position of the molecular marker (in kilodaltons) is indicated. e HeLa cells were treated with etoposide (10 μM) for the indicated period, and a caspase 3/7 assay was performed to detect apoptosis. The blank value was subtracted from the actual measured value. Values represent the mean ± standard deviation (n = 4; **P < 0.01; ***P < 0.001 versus DMSO). f HeLa cells were treated with etoposide (10 μM) for the indicated period, and a western blot analysis was performed with the indicated antibody. Left, the position of the molecular marker (in kilodaltons) is indicated. g The blot image in (f) was processed using Quantity One. Briefly, each specific band was quantified by volume analysis using the background subtraction method and the resulting density was represented as the ratio of etoposide/DMSO. The resulting ratio was further normalized by the corresponding GAPDH band. h HeLa cells were treated with etoposide (10 μM) for the indicated period, and a TaqMan real-time RT-PCR was performed with the BiP primer. In each panel, GAPDH was used as an internal standard. Values represent the mean ± standard deviation (n = 2). i HeLa cells were treated with etoposide (10 μM) for the indicated period (left) and thapsigargin (0.5 μM) for 8 h (right), and a TaqMan real-time RT-PCR was performed with the XBP1 primer. In each panel, GAPDH was used as an internal standard. Values represent the mean ± standard deviation (n = 2). j HeLa cells were treated with etoposide (10 μM) for 48 h, and a western blot analysis was performed with the indicated antibody. Left, the position of the molecular marker (in kilodaltons) is indicated
Fig. 6
Fig. 6
Effect of proteasomal inhibitor on BiP protein. a HeLa cells were treated with DMSO or etoposide (10 μM) for 24 h with or without MG132 for the latter 12 h, and a western blot analysis was performed using the indicated antibody. Left, the position of the molecular marker (in kilodaltons) is indicated. b HeLa cells were treated with the indicated proteasomal inhibitor (each 10 μM) or ubiquitin aldehyde (0.5 μM) for 12 h, and a western blot analysis was performed using the indicated antibody. Left, the position of the molecular marker (in kilodaltons) is indicated
Fig. 7
Fig. 7
Diagrammatic illustration of the UPR gene regulatory network. a BiP, CHOP, and XBP1 have a positive feedback loop (indicated by the arrow) and are related to one another to secure robust and uniform gene expression as part of the ER stress response. For example, BiP and CHOP positively regulate each other. In addition, the BiP, CHOP, and XBP1 promoters have multiple layers of inputs consisting of UPR genes such as PERK, IRE1, ATF6, and ATF4. b Based on the results obtained in this study, the regulation of UPR genes centered on the ERSE (BiP, CHOP, and XBP1 genes) and the UPRE can be divided into two groups. As a matter of convenience, we call these groups X and Y in this figure. X contains all of the UPR genes, whereas Y consists of all the UPR genes except for BiP, CHOP, and ATF4. In other words, X and Y share XBP1, PERK, IRE1, and ATF6, and only these genes can induce both ERSE- and UPRE-dependent transcription. On the other hand, BiP, CHOP, and ATF4 exclusively belong to X and positively regulate ERSE, except for the XBP1 promoter. Taken together, our results suggest that cells might creatively use X (in other words, all the UPR genes, agreeing with the results obtained using RT-PCR in which all the UPR genes were transcriptionally activated by thapsigargin) and Y depending on the degree of ER stress. Alternatively, only BiP and CHOP can increase the amount of their expressions by changing from Y to X. This finding implies that cells resort to additional BiP expression to overcome unresolved and prolonged ER stress, and while simultaneous, a cellular strategy solicits the induction of apoptosis by CHOP

Similar articles

Cited by

References

    1. Cao X, Zhou Y, Lee AS. Requirement of tyrosine- and serine/threonine kinases in the transcriptional activation of the mammalian grp78/BiP promoter by thapsigargin. J Biol Chem. 1995;270:494–502. doi: 10.1074/jbc.270.1.494. - DOI - PubMed
    1. Chérasse Y, Chaveroux C, Jousse C, Maurin AC, Carraro V, Parry L, Fafournoux P, Bruhat A. Role of the repressor JDP2 in the amino acid-regulated transcription of CHOP. FEBS Lett. 2008;582:1537–1541. doi: 10.1016/j.febslet.2008.03.050. - DOI - PubMed
    1. Donoso G, Herzog V, Schmitz A. Misfolded BiP is degraded by a proteasome-independent endoplasmic-reticulum-associated degradation pathway. Biochem J. 2005;387:897–903. doi: 10.1042/BJ20041312. - DOI - PMC - PubMed
    1. Fawcett TW, Martindale JL, Guyton KZ, Hai T, Holbrook NJ. Complexes containing activating transcription factor (ATF)/cAMP-responsive-element-binding protein (CREB) interact with the CCAAT/enhancer-binding protein (C/EBP)-ATF composite site to regulate Gadd153 expression during the stress response. Biochem J. 1999;339:135–141. doi: 10.1042/0264-6021:3390135. - DOI - PMC - PubMed
    1. Hetz C. The unfolded protein response: controlling cell fate decisions under ER stress and beyond. Nat Rev Mol Cell Biol. 2012;13:89–102. - PubMed

MeSH terms