

Coordination of fibronectin adhesion with contraction and relaxation in microvascular smooth muscle
- PMID: 22802110
- PMCID: PMC3584957
- DOI: 10.1093/cvr/cvs239
Coordination of fibronectin adhesion with contraction and relaxation in microvascular smooth muscle
Abstract
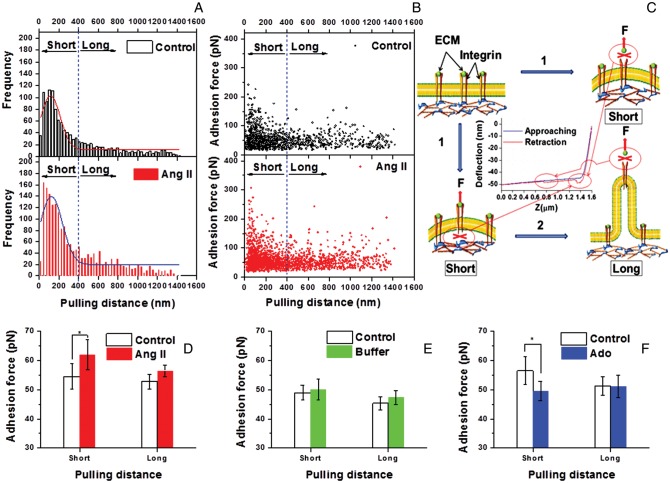
Aims: The regulation of vascular diameter by vasoconstrictors and vasodilators requires that vascular smooth muscle cells (VSMCs) be physically coupled to extracellular matrix (ECM) and neighbouring cells in order for a vessel to mechanically function and transfer force. The hypothesis was tested that integrin-mediated adhesion to the ECM is dynamically up-regulated in VSMCs during contractile activation in response to a vasoconstrictor and likewise down-regulated during relaxation in response to a vasodilator.
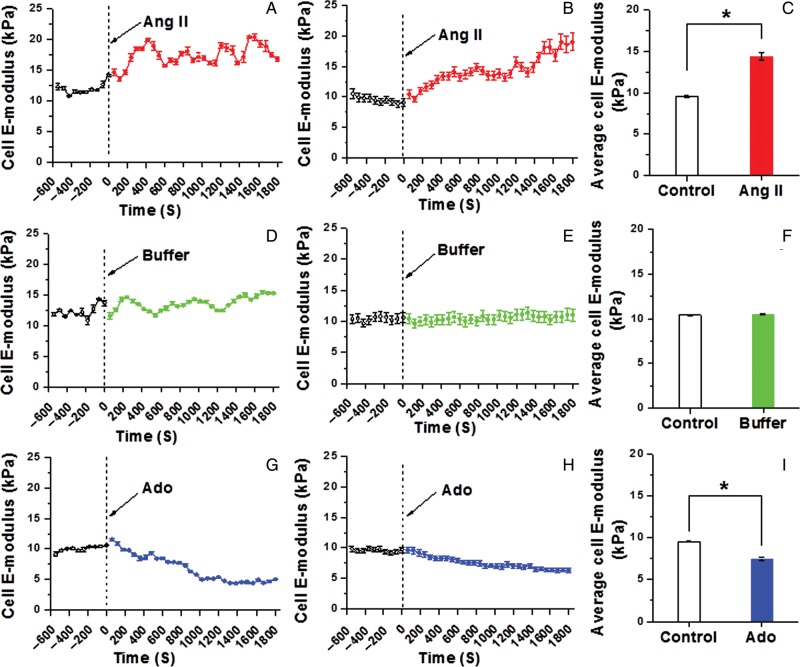
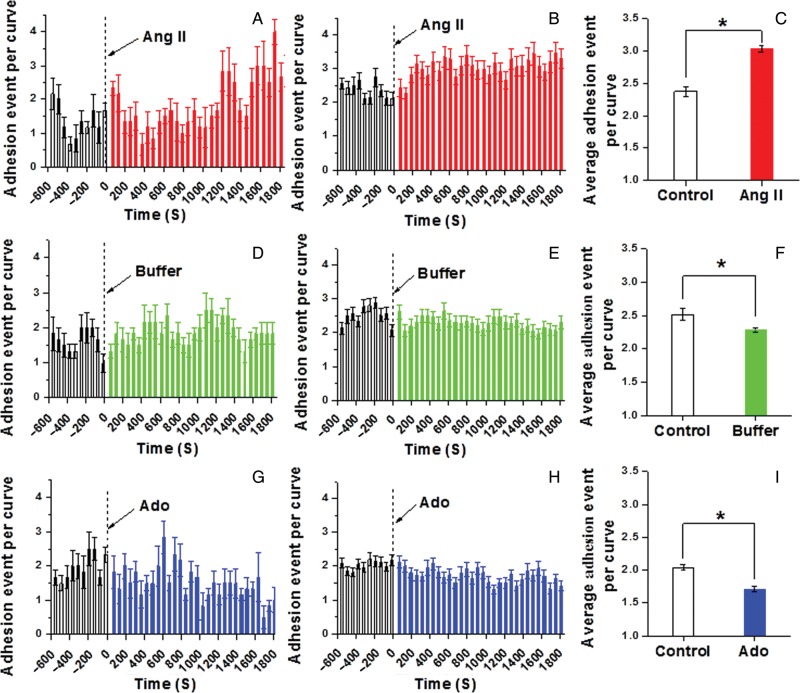
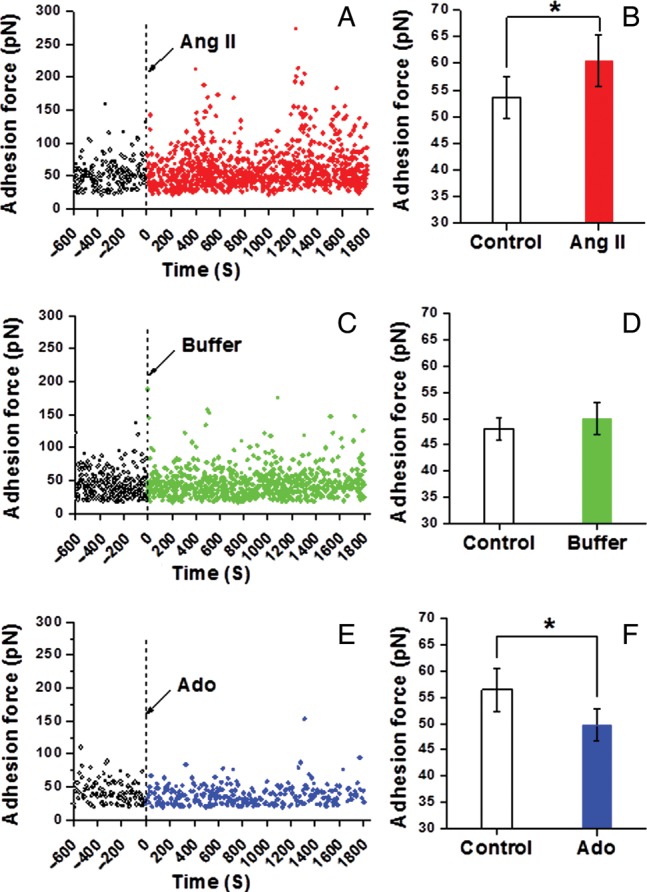
Methods and results: VSMCs were isolated from the Sprague-Dawley rat cremaster muscles. Atomic force microscopy (AFM) with fibronectin (FN)-functionalized probes was employed to investigate the biomechanical responses and adhesion of VSMCs. Responses to angiotensin II (Ang II; 10(-6) M) and adenosine (Ado; 10(-4) M) were recorded by measurements of cell cortical elasticity and cell adhesion. The results showed that Ang II caused an immediate increase in adhesion (+27%) between the probe and cell. Cell stiffness increased (+70%) in parallel with the adhesion change. Ado decreased adhesion (-15%) to FN and reduced (-30%) stiffness.
Conclusion: Changes in the receptor-mediated activation of the contractile apparatus cause parallel alterations in cell adhesion and cell cortical elasticity. These studies support the hypothesis that the regulation of cell adhesion is coordinated with contraction and demonstrate the dynamic nature of cell adhesion to the ECM. It is proposed that coordination of adhesion and VSMC contraction is an important mechanism that allows for an efficient transfer of force between the contractile apparatus of the cell and the extracellular environment.
Figures
Comment in
-
The integrin-cortex complex under control of GPCRs.Cardiovasc Res. 2012 Oct 1;96(1):7-8. doi: 10.1093/cvr/cvs269. Epub 2012 Aug 16. Cardiovasc Res. 2012. PMID: 22899701 No abstract available.
Similar articles
-
Vascular smooth muscle cell stiffness and adhesion to collagen I modified by vasoactive agonists.PLoS One. 2015 Mar 6;10(3):e0119533. doi: 10.1371/journal.pone.0119533. eCollection 2015. PLoS One. 2015. PMID: 25745858 Free PMC article.
-
Calcium in Vascular Smooth Muscle Cell Elasticity and Adhesion: Novel Insights Into the Mechanism of Action.Front Physiol. 2019 Aug 7;10:852. doi: 10.3389/fphys.2019.00852. eCollection 2019. Front Physiol. 2019. PMID: 31440163 Free PMC article. Review.
-
Vasoactive agonists exert dynamic and coordinated effects on vascular smooth muscle cell elasticity, cytoskeletal remodelling and adhesion.J Physiol. 2014 Mar 15;592(6):1249-66. doi: 10.1113/jphysiol.2013.264929. Epub 2014 Jan 20. J Physiol. 2014. PMID: 24445320 Free PMC article.
-
Membrane cholesterol and substrate stiffness co-ordinate to induce the remodelling of the cytoskeleton and the alteration in the biomechanics of vascular smooth muscle cells.Cardiovasc Res. 2019 Jul 1;115(8):1369-1380. doi: 10.1093/cvr/cvy276. Cardiovasc Res. 2019. PMID: 30395154 Free PMC article.
-
Regulation of Vascular Smooth Muscle Cell Stiffness and Adhesion by [Ca2+]i: An Atomic Force Microscopy-Based Study.Microsc Microanal. 2018 Dec;24(6):708-712. doi: 10.1017/S1431927618015519. Epub 2018 Dec 5. Microsc Microanal. 2018. PMID: 30516127 Free PMC article.
Cited by
-
Vascular smooth muscle cell stiffness and adhesion to collagen I modified by vasoactive agonists.PLoS One. 2015 Mar 6;10(3):e0119533. doi: 10.1371/journal.pone.0119533. eCollection 2015. PLoS One. 2015. PMID: 25745858 Free PMC article.
-
Calcium in Vascular Smooth Muscle Cell Elasticity and Adhesion: Novel Insights Into the Mechanism of Action.Front Physiol. 2019 Aug 7;10:852. doi: 10.3389/fphys.2019.00852. eCollection 2019. Front Physiol. 2019. PMID: 31440163 Free PMC article. Review.
-
Lysophosphatidic acid induces integrin activation in vascular smooth muscle and alters arteriolar myogenic vasoconstriction.Front Physiol. 2014 Oct 31;5:413. doi: 10.3389/fphys.2014.00413. eCollection 2014. Front Physiol. 2014. PMID: 25400583 Free PMC article.
-
Switching behaviour in vascular smooth muscle cell-matrix adhesion during oscillatory loading.J Theor Biol. 2020 Oct 7;502:110387. doi: 10.1016/j.jtbi.2020.110387. Epub 2020 Jun 27. J Theor Biol. 2020. PMID: 32603668 Free PMC article.
-
Modification of Fibronectin by Non-Enzymatic Glycation Impairs K+ Channel Function in Rat Cerebral Artery Smooth Muscle Cells.Front Physiol. 2022 Jun 27;13:871968. doi: 10.3389/fphys.2022.871968. eCollection 2022. Front Physiol. 2022. PMID: 35832482 Free PMC article.
References
-
- Ingber DE. Mechanical signaling and the cellular response to extracellular matrix in angiogenesis and cardiovascular physiology. Circ Res. 2002;91:877–887. doi:10.1161/01.RES.0000039537.73816.E5. - DOI - PubMed
-
- Gunst SJ, Zhang W. Actin cytoskeletal dynamics in smooth muscle: a new paradigm for the regulation of smooth muscle contraction. Am J Physiol Cell Physiol. 2008;295:C576–587. doi:10.1152/ajpcell.00253.2008. - DOI - PMC - PubMed
-
- Balasubramanian L, Ahmed A, Lo CM, Sham JS, Yip KP. Integrin-mediated mechanotransduction in renal vascular smooth muscle cells: activation of calcium sparks. Am J Physiol Regul Integr Comp Physiol. 2007;293:R1586–R1594. doi:10.1152/ajpregu.00025.2007. - DOI - PubMed
-
- Delon I, Brown NH. Integrins and the actin cytoskeleton. Curr Opin Cell Biol. 2007;19:43–50. doi:10.1016/j.ceb.2006.12.013. - DOI - PubMed
-
- Goldschmidt ME, McLeod KJ, Taylor WR. Integrin-mediated mechanotransduction in vascular smooth muscle cells: frequency and force response characteristics. Circ Res. 2001;88:674–680. doi:10.1161/hh0701.089749. - DOI - PubMed
Publication types
MeSH terms
Substances
Grants and funding
LinkOut - more resources
Full Text Sources
Miscellaneous
