. 2012 Jul 30;209(8):1457-68.
doi: 10.1084/jem.20120225. Epub 2012 Jul 16.

Hematopoietic stem cell development requires transient Wnt/β-catenin activity

Affiliations

Hematopoietic stem cell development requires transient Wnt/β-catenin activity

Cristina Ruiz-Herguido et al. J Exp Med. .

Abstract

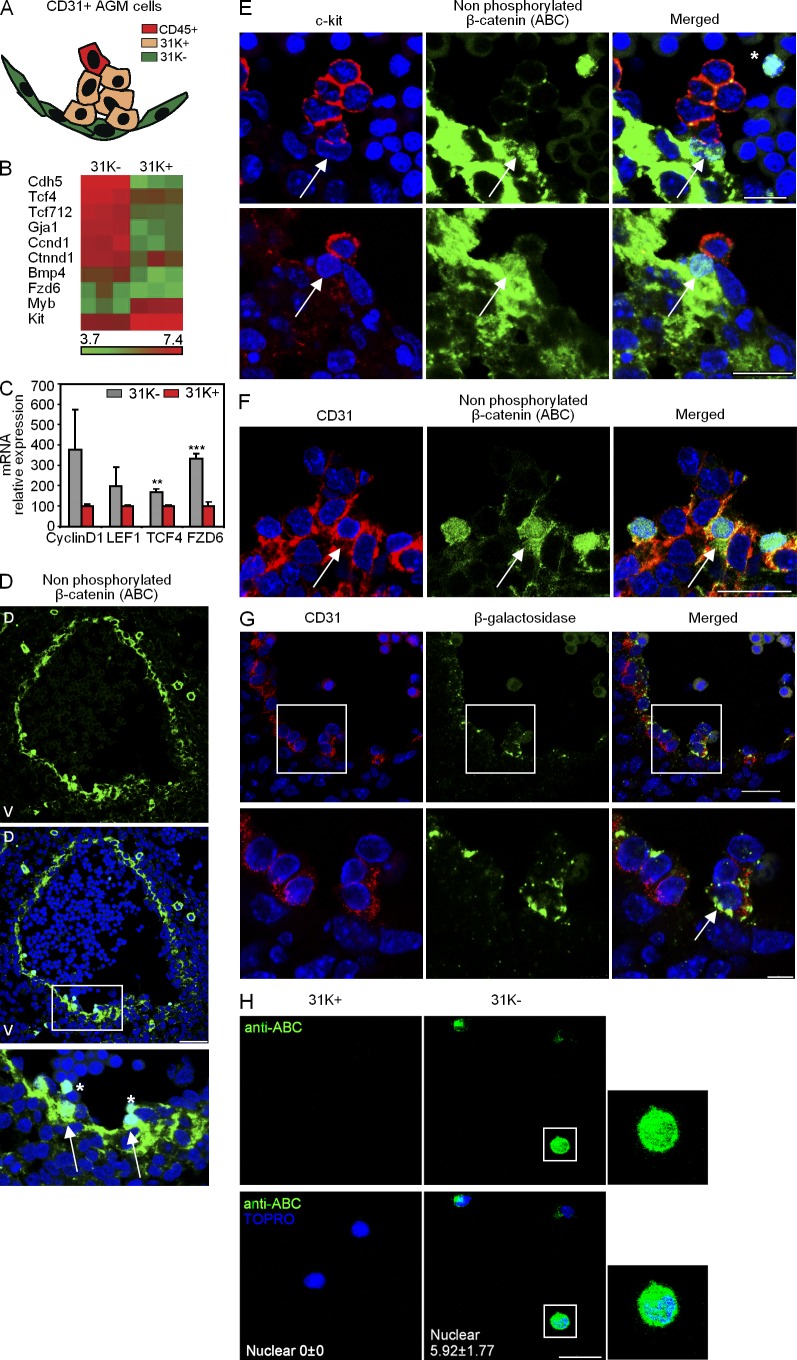
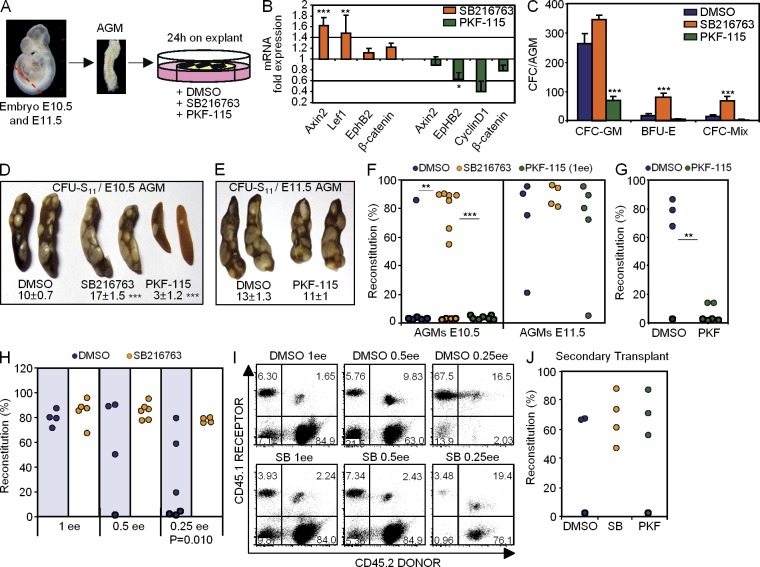
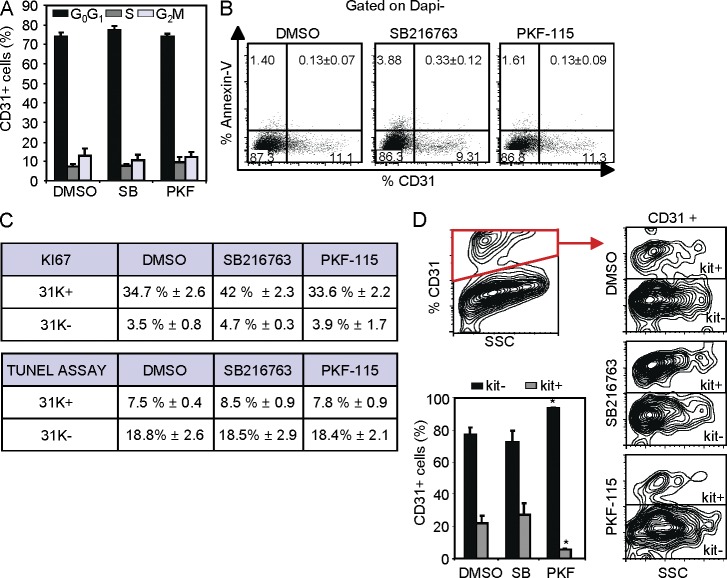
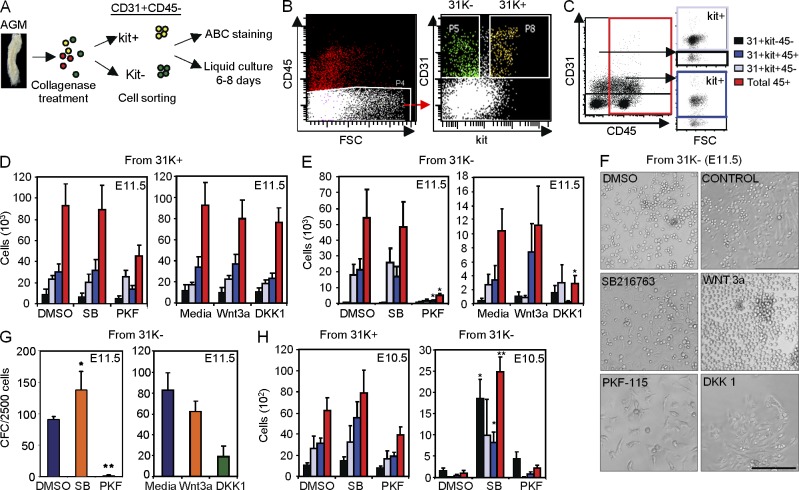
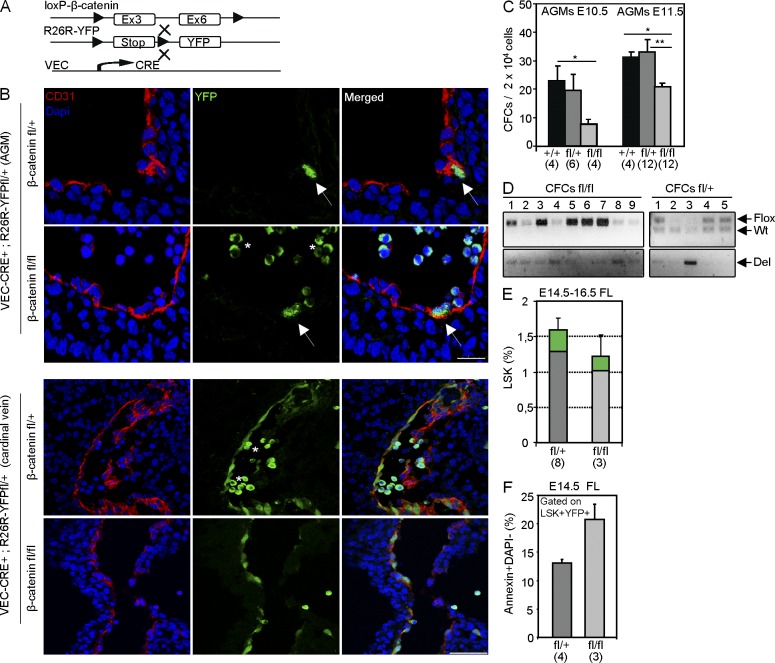
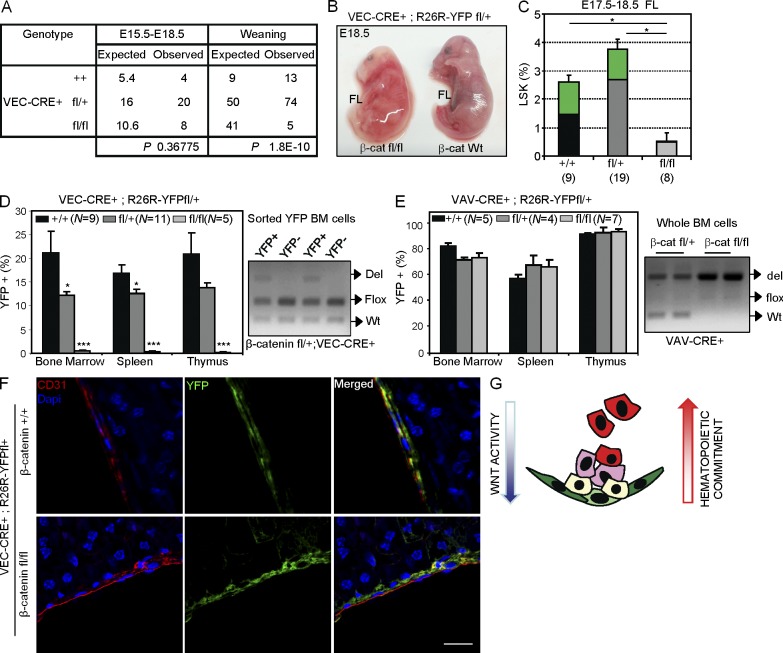
Understanding how hematopoietic stem cells (HSCs) are generated and the signals that control this process is a crucial issue for regenerative medicine applications that require in vitro production of HSC. HSCs emerge during embryonic life from an endothelial-like cell population that resides in the aorta-gonad-mesonephros (AGM) region. We show here that β-catenin is nuclear and active in few endothelial nonhematopoietic cells closely associated with the emerging hematopoietic clusters of the embryonic aorta during mouse development. Importantly, Wnt/β-catenin activity is transiently required in the AGM to generate long-term HSCs and to produce hematopoietic cells in vitro from AGM endothelial precursors. Genetic deletion of β-catenin from the embryonic endothelium stage (using VE-cadherin-Cre recombinase), but not from embryonic hematopoietic cells (using Vav1-Cre), precludes progression of mutant cells toward the hematopoietic lineage; however, these mutant cells still contribute to the adult endothelium. Together, those findings indicate that Wnt/β-catenin activity is needed for the emergence but not the maintenance of HSCs in mouse embryos.


Figures

Figure 1.
Figure 1.
Wnt/β-catenin activity is restricted to few endothelial nonhematopoietic cells in the AGM. (A) Representation of the surface markers expressed in CD31+ cells to illustrate different endothelial/hematopoietic cell populations present in the AGM region. 31K, C31+c-kitCD45; and 31K+, CD31+c-kit+CD45. (B) Wnt signature enrichment in the 31K cells compared with 31K+ in the E11.5 AGM. The heat map represents fold change in differentially expressed genes (P < 0.05). (C) Validation of microarray data by qRT-PCR. Fold change is shown as relative to 31K+ population after normalization by β-actin (n = 2 independent experiments; mean ± SEM). Significant differences are indicated by asterisks (**, P ≤ 0.01; ***, P ≤ 0.001; P > 0.05, unlabeled). (D) Confocal images of a transverse section of E10.5 AGM stained for nonphosphorylated ABC (green), with a detail of nuclear staining in specific endothelial cells (bottom, arrows). Bar, 100 µm. (E) Details of confocal images (E10.5) of hematopoietic clusters with c-kit (red) and ABC (green). Arrows point to nuclear staining at the base of c-kit+ cells. Bars, 25 µm. (F) Detail of confocal images (E10.5) with CD31 (red) and ABC (green). Arrows point to nuclear staining of CD31+ cells. Bar, 25 µm. (G, top) Confocal image of a transversal section of E11.5 AGM from TOPGAL+ embryo stained with anti–β-galactosidase (green) and CD31 (red). Bar, 25 µm. (G, bottom) Arrow points to a CD31+TOPGAL+ cell at the base of a cluster. Bar, 75 µm. (H) Details of confocal images of 31K or 31K+ sorted from E11.5 AGM cells on slides and immunostained with ABC (green), and a merged image with TOPRO-3 (bottom, blue). Bar, 75 µm. Also shown is a zoom of a cell with nuclear staining (right; n = 3 independent experiments, data shown as mean ± SEM of cell counts of at least five unselected regions with >150 cells counted). Nuclear staining with DAPI is shown in D–G. Asterisks in D and E indicate circulating cells (CD31c-kit) with ABC nuclear staining. D, dorsal; V, ventral.
Figure 2.
Figure 2.
β-Catenin activity is required to generate HSCs in the E10.5 AGM. (A) Procedure for AGM explant culture. SB216763 is a GSK3-β inhibitor (β-catenin activator), and PKF-115-584 impairs the binding of β-catenin to TCF (β-catenin inhibitor). (B) qRT-PCR of β-catenin target genes in AGM-treated explants. Results were normalized by β-actin expression and represented as fold increase over the DMSO explant (n = 3 independent experiments, data shown as mean ± SEM). (C) Clonogenic progenitors detected in E10.5 AGMs that were treated as indicated. Clonogenic progenitors were analyzed in methylcellulose cultures. Bars show the mean ± SEM of total hematopoietic progenitors types (CFC-GM, BFU-E, and CFC-Mix; n = 6 AGMs from two independent experiments). (D and E) Spleen images of CFU-S11 obtained from animals transplanted with E10.5 (D) or E11.5 (E) 24-h AGM explant cultures (DMSO n = 12, SB n = 6, and PKF-115 n = 8 for E10.5; DMSO n = 11 and PFK n = 8 for E11.5; n represents the number of AGM/spleen per condition from at least three independent experiments). Zero to two colonies were detected in irradiated noninjected control mice. The mean ± SEM of colonies per tissue is indicated. (F) Transplantation of β-actinGFP+ E10.5 (left) and E11.5 (right) 24-h AGM-treated explants. Engraftment was measured as the percentage of GFP+ cells within the recipient hematopoietic (CD45+) compartment in peripheral blood (PB) after 16 wk. (G) Engraftment of DMSO-treated or PKF-115–treated E10.5 AGM explants (2 ee) measured in PB 13 wk after transplantation. (H) Quantification of HSC activity by limiting dilution transplantation performed in the CD45.1/CD45.2 system. Engraftment in PB at 16 wk after transplantation of E11.5 AGM explant (1, 0.5, or 0.25 ee) treated with DMSO or SB216763. (I) Dot plot of representative analysis from transplanted animals in H. Single CD45.2+ cells are from the donor AGM, single CD45.1+ cells are from the recipient, and double CD45.1+/CD45.2+ are from spleen cells used as hematopoietic support. (J) Engraftment measured as the percentage of GFP+ cells within the CD45+ compartment in PB at 16 wk after the secondary transplantation of AGM explant at E11.5 from F. (F, G, H, and J) Each dot represents one recipient animal. Data are cumulative of at least three independent experiments. Significant differences are indicated by asterisks (*, P ≤ 0.05; **, P ≤ 0.01; ***, P ≤ 0.001; P > 0.05, unlabeled).
Figure 3.
Figure 3.
β-Catenin facilitates hematopoietic differentiation from endothelial precursors. (A and B) Determination of cell cycle by Hoechst staining (A) and apoptosis by Annexin V binding (B) in the CD31+ cells from 24-h AGM explants (E11.5) after the indicated treatments by flow cytometry (n = 3 independent experiments, data shown as mean ± SEM). (C) Mean percentage ± SEM of cells positive for Ki67 staining (top table) and TUNEL assay (bottom table) in the indicated subpopulations. Cells from 24-h-treated E11.5 AGM explants from three independent experiments were directly sorted on slides. Cell counts (>300) from at least five unselected regions have been included. (D) Relative determination of endothelial (c-kit) and hematopoietic (c-kit+) cells within the CD31+ population in E11.5 24-h AGM-treated explants. Contour plots from a representative experiment. Bars represent percentage of each population (n = 4 independent experiments, data shown as mean ± SEM). Significant differences are indicated by asterisks (*, P ≤ 0.05; P > 0.05, unlabeled).
Figure 4.
Figure 4.
31K cells are the target of β-catenin activation to produce hematopoietic cells. (A) Experimental design. (B) Example of sorting windows used to define 31K and 31K+ subpopulations (see Fig. S1 for purity analysis). (C) Strategy for flow cytometry analysis used in D, E, and H (Endothelial cells: CD31+c-kitCD45, black box; prehematopoietic cells: CD31+c-kit+CD45, gray box; hematopoietic progenitors: CD31+c-kit+CD45+, blue box; total hematopoietic cells: CD45+, red box). (D and E) 1,500 cells from 31K+ (D) and 10,000 cells from 31K (E) sorted populations were cultured for 6 and 8 d, respectively. Bars show the total number of the indicated cells obtained from 31K+ (D) and 31K (E) populations (n ≥ 5 independent experiments). (F) Zoom of representative images from 31K cells after 8 d in liquid culture with the indicated treatments. Bar, 75 µm. (G) Relative number of clonogenic progenitors from 31K cells after 8 d in culture (n ≥ 7 independent experiments). (H) 1,100 cells from 31K+ and 10,000 cells from 31K sorted from E10.5 AGMs were cultured as in D and E. Bars show the total number of the indicated cell types obtained from 31K+ (left) and 31K (right) populations (n ≥ 4 independent experiments). n, number of independent experiments; mean ± SEM. Significant differences are indicated by asterisks (*, P ≤ 0.05; **, P ≤ 0.01; P > 0.05, unlabeled). Differences in PKF cultures from 31K+ are nonsignificant compared with SB-treated (p-values are 0.79 [black], 0.64 [gray], 0.12 [blue], and 0.13 [red]) or DMSO-treated (p-values are 0.54 [black], 0.72 [gray], 0.18 [blue], and 0.17 [red]) cultures.
Figure 5.
Figure 5.
β-catenin deletion has a deleterious effect on the embryonic hematopoietic progenitors. (A) Conditional deletion of β-catenin in the endothelium. VEC-Cre mice were crossed with R26R-YFP and loxP–β-catenin mice. (B) Detail of confocal image of a transversal section showing endothelium from E10.5 AGM (top) and E11.5 cardinal vein (bottom) from β-catenin fl/+ and β-catenin fl/fl embryos stained for GFP (green) and CD31 (red). Arrows point to CD31+GFP+ cells. Bars, 25 µm. Asterisks indicate autofluorescent circulating cells. (C) Number of CFCs obtained from 2 × 10⁴ AGM cells at E10.5 (left) and E11.5 (right) with the indicated genotypes. (D) Genotype of individual CFC colonies assessed by PCR. Del: deleted band. (E) Percentage of LSK cells in FL at E14.5–16.5 from the different genotypes. Green represents the contribution of YFP+ cells to the LSK population. (F) Percentage of Annexin+Dapi apoptotic cells within the YFP+ LSK in FL at E14.5 from the different genotypes. Numbers in brackets indicate the number of embryos analyzed in at least three independent experiments. Data are shown as mean ± SEM. Significant differences compared with control are indicated by asterisks (*, P < 0.05; **, P < 0.01; P > 0.05, unlabeled).
Figure 6.
Figure 6.
β-Catenin activity is required in the embryonic endothelium to contribute to adult hematopoiesis. (A) Genotype of progeny from loxP–β-catenin and VEC-Cre intercrosses at different stages (See Fig. S2 A for crossing details). (B) Representative image of affected E18.5 VEC-Cre+;β-catenin Wt or fl/fl fetuses. (C) Percentage of LSK cells in FL at E17.5–18.5 from the different genotypes. Green represents the contribution of YFP+ cells to the LSK population. (D and E) Percentage of YFP+ cells detected in adult hematopoietic organs from VEC-Cre;R26R-YFP;β-catenin +/+, fl/+, or fl/fl (D) or Vav1-Cre;R26R-YFP;β-catenin +/+, fl/+, or fl/fl (E) mice analyzed at 3 mo (left). Analysis of β-catenin allele recombination detected by PCR in the genomic DNA from YFP+ BM sorted cells of VEC-Cre;β-catenin fl/+;R26R-YFP mouse (D, right) and whole BM cells of Vav1-Cre;β-catenin fl/+ or fl/fl;R26R-YFP (E, right). (C–E) Data are shown as mean ± SEM and numbers in brackets indicate the number of mice analyzed. Significant differences compared with control are indicated by asterisks (*, P ≤ 0.05; ***, P ≤ 0.001; P > 0.05, unlabeled). (F) Details of confocal images of CD31+ (red) and YFP+ (green) cells in adult liver from β-catenin +/+ or fl/fl mice crossed with VEC-Cre;R26R-YFP analyzed at 3 mo of age. Bar, 75 µm. (G) Model of Wnt/β-catenin activity in the embryonic AGM. Wnt/β-catenin signaling is required in the endothelial-like cells to generate hematopoietic progenitors and stem cells but gradually decreases after hematopoietic commitment.

Similar articles

Cited by

References

    1. Alva J.A., Zovein A.C., Monvoisin A., Murphy T., Salazar A., Harvey N.L., Carmeliet P., Iruela-Arispe M.L. 2006. VE-Cadherin-Cre-recombinase transgenic mouse: a tool for lineage analysis and gene deletion in endothelial cells. Dev. Dyn. 235:759–767 10.1002/dvdy.20643 - DOI - PubMed
    1. Brault V., Moore R., Kutsch S., Ishibashi M., Rowitch D.H., McMahon A.P., Sommer L., Boussadia O., Kemler R. 2001. Inactivation of the beta-catenin gene by Wnt1-Cre-mediated deletion results in dramatic brain malformation and failure of craniofacial development. Development. 128:1253–1264 - PubMed
    1. Burns C.E., Traver D., Mayhall E., Shepard J.L., Zon L.I. 2005. Hematopoietic stem cell fate is established by the Notch-Runx pathway. Genes Dev. 19:2331–2342 10.1101/gad.1337005 - DOI - PMC - PubMed
    1. Cattelino A., Liebner S., Gallini R., Zanetti A., Balconi G., Corsi A., Bianco P., Wolburg H., Moore R., Oreda B., et al. 2003. The conditional inactivation of the β-catenin gene in endothelial cells causes a defective vascular pattern and increased vascular fragility. J. Cell Biol. 162:1111–1122 10.1083/jcb.200212157 - DOI - PMC - PubMed
    1. Chen M.J., Yokomizo T., Zeigler B.M., Dzierzak E., Speck N.A. 2009. Runx1 is required for the endothelial to haematopoietic cell transition but not thereafter. Nature. 457:887–891 10.1038/nature07619 - DOI - PMC - PubMed

Publication types

MeSH terms