. 2012 Aug;140(2):219-33.
doi: 10.1085/jgp.201110762. Epub 2012 Jul 16.

Origin and control of the dominant time constant of salamander cone photoreceptors

Affiliations

Origin and control of the dominant time constant of salamander cone photoreceptors

Jingjing Zang et al. J Gen Physiol. 2012 Aug.

Abstract

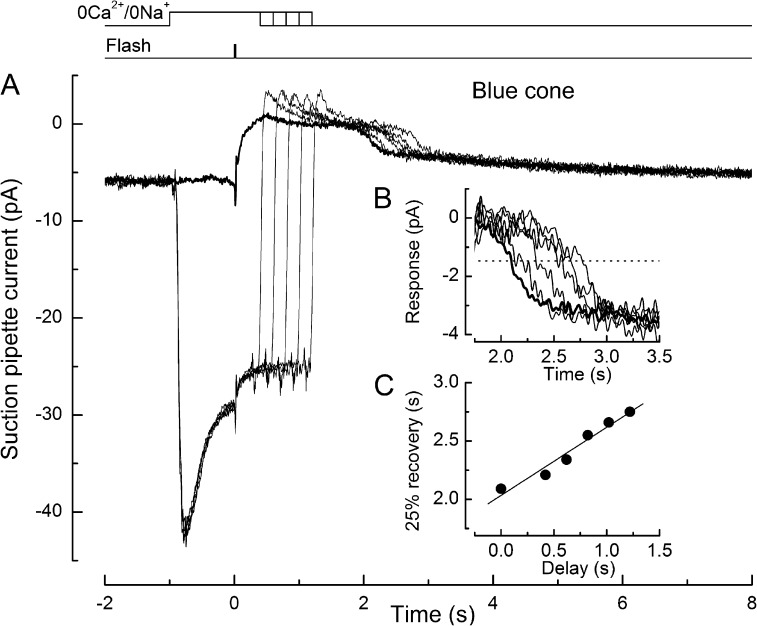
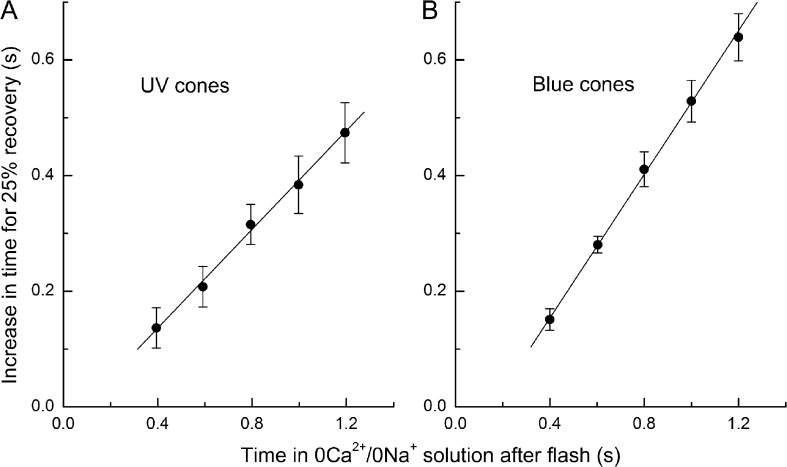
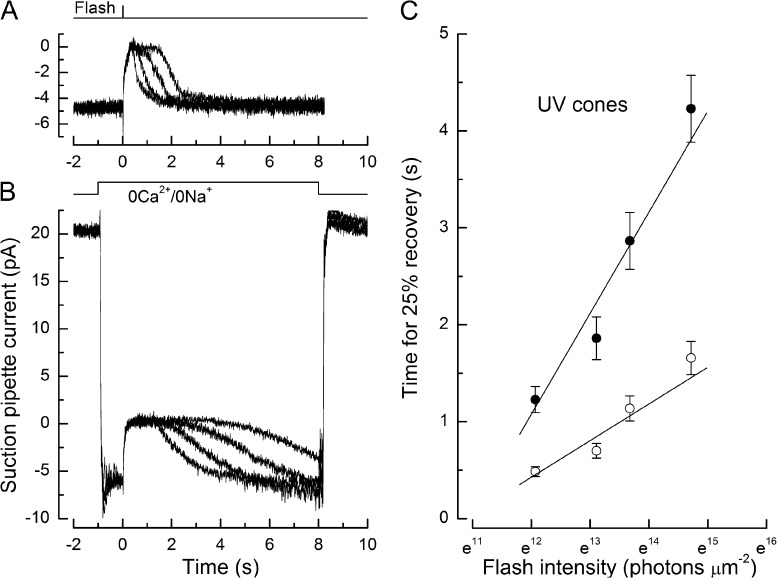
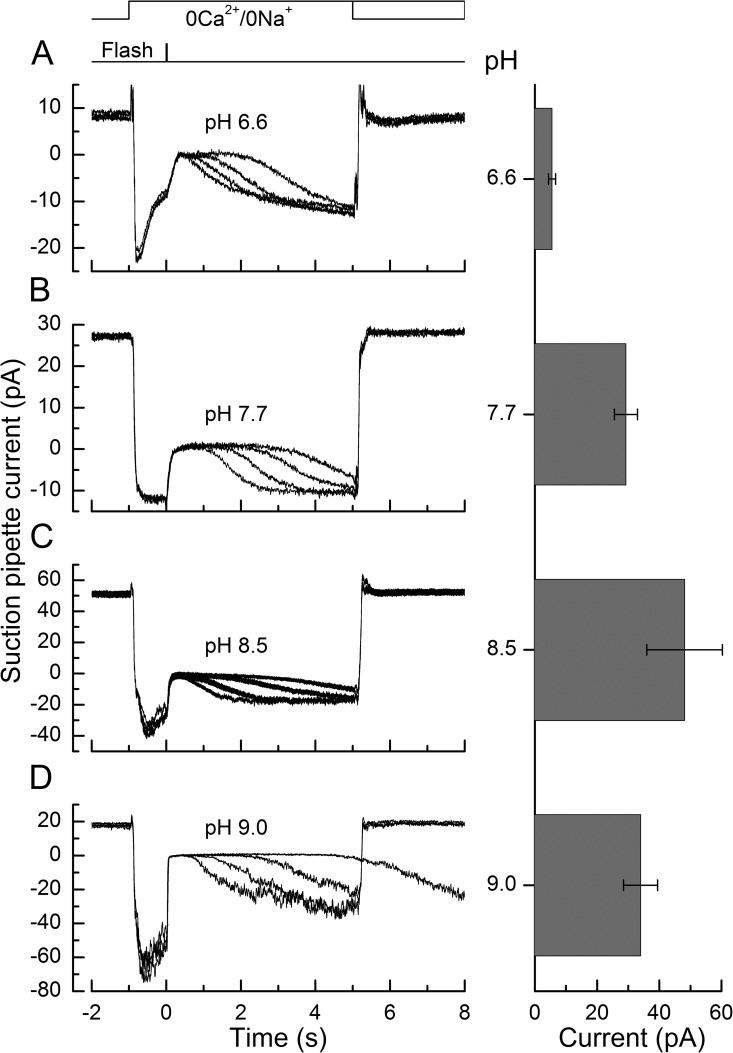
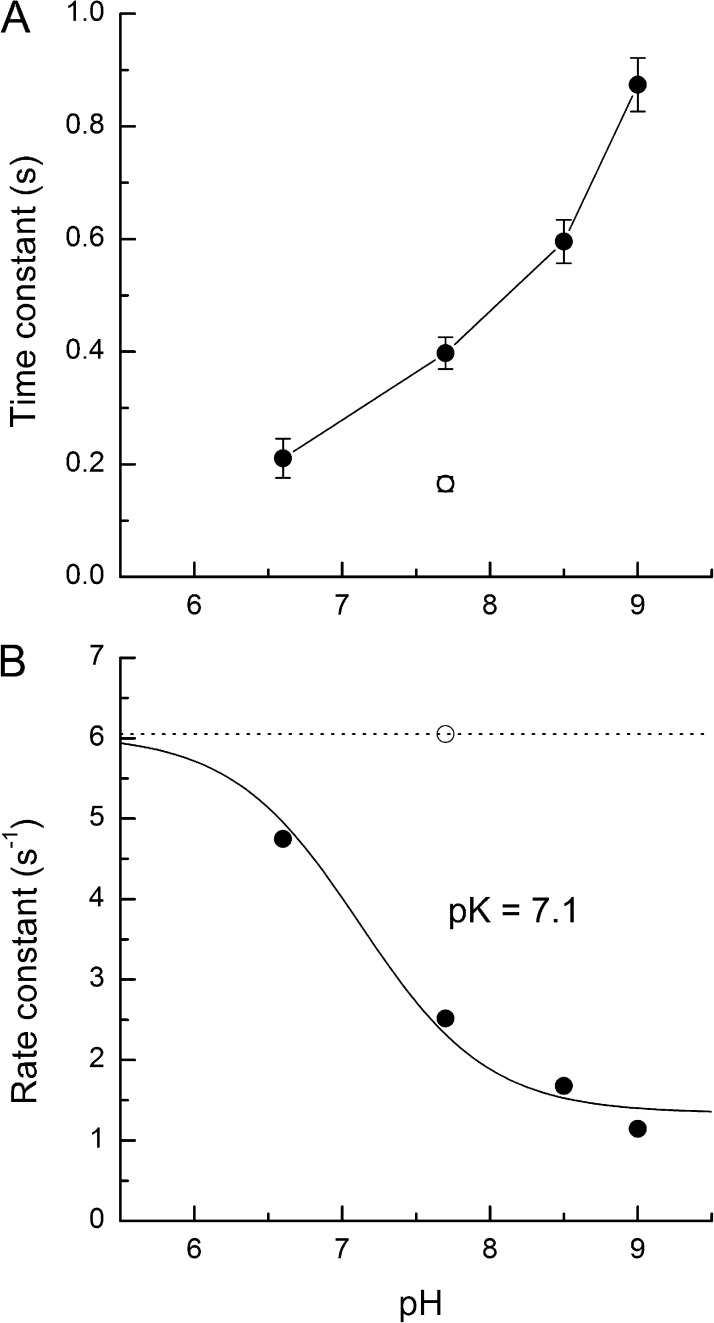
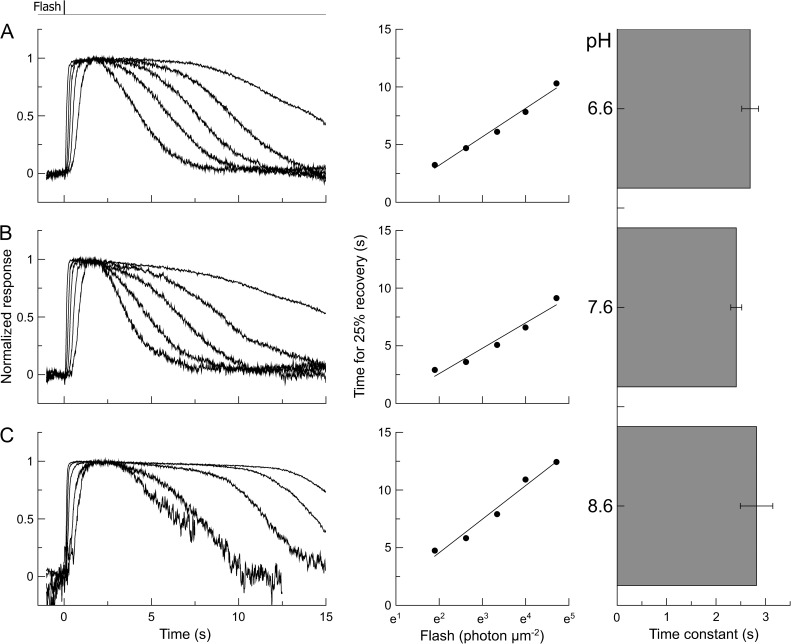
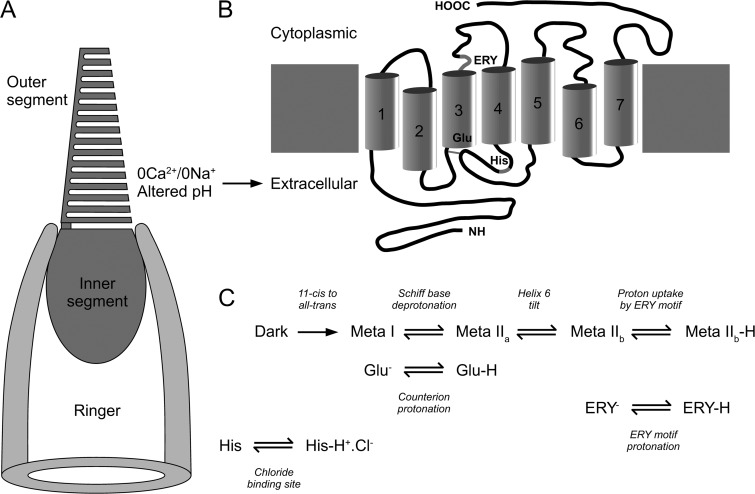
Recovery of the light response in vertebrate photoreceptors requires the shutoff of both active intermediates in the phototransduction cascade: the visual pigment and the transducin-phosphodiesterase complex. Whichever intermediate quenches more slowly will dominate photoresponse recovery. In suction pipette recordings from isolated salamander ultraviolet- and blue-sensitive cones, response recovery was delayed, and the dominant time constant slowed when internal [Ca(2+)] was prevented from changing after a bright flash by exposure to 0Ca(2+)/0Na(+) solution. Taken together with a similar prior observation in salamander red-sensitive cones, these observations indicate that the dominance of response recovery by a Ca(2+)-sensitive process is a general feature of amphibian cone phototransduction. Moreover, changes in the external pH also influenced the dominant time constant of red-sensitive cones even when changes in internal [Ca(2+)] were prevented. Because the cone photopigment is, uniquely, exposed to the external solution, this may represent a direct effect of protons on the equilibrium between its inactive Meta I and active Meta II forms, consistent with the notion that the process dominating recovery of the bright flash response represents quenching of the active Meta II form of the cone photopigment.


Figures

Figure 1.
Figure 1.
Effect on the bright flash response in a salamander UV-sensitive cone of superfusion with 0Ca2+/0Na+ solution. (A) Superimposed responses to saturating flashes in Ringer’s solution (heavy trace) and upon exposure to 0Ca2+/0Na+ solution from 1 s before the flash until progressively increasing times thereafter (light traces). Top traces represent solution change and flash command timings. Suction pipette currents include a junction current resulting from the liquid junction potential between the dissimilar solutions in pipette and bath. Each trace is the mean of two responses; measurements were bracketed symmetrically in time. The bright flash delivered 2.5 × 10⁶ photons µm−2 at 362 nm. (B) Recovery phases of the responses from A after subtraction of the junction current obtained on the return to Ringer’s solution after a 2-s exposure to 0Ca2+/0Na+ solution at the end of the experiment. For each trace, the junction current has been offset in time to coincide with the return to Ringer’s solution. Data have been digitally low-pass filtered at 20 Hz. The heavy trace denotes the response in Ringer’s solution. (C) Dependence of response duration on the time spent in 0Ca2+/0Na+ solution after the flash. Response duration was measured as the time taken after the flash for 25% recovery of current (dashed line in B). Times of the solution changes were measured from the half-relaxation time of the junction current. Regression line of slope 0.43 was fitted using a least-squares algorithm.
Figure 2.
Figure 2.
Effect on the bright flash response in a salamander blue-sensitive cone of superfusion with 0Ca2+/0Na+ solution. (A) Superimposed responses to saturating flashes in Ringer’s solution (heavy trace) and upon exposure to 0Ca2+/0Na+ solution from 1 s before the flash until progressively increasing times thereafter (light traces). Top traces represent solution change and flash command timings. Suction pipette currents have not been corrected for the junction current. Each trace is the mean of two responses. The bright flash delivered 3.3 × 10⁵ photons µm−2 at 436 nm. (B) Recovery phases of the responses from A after subtraction of the junction current as in Fig. 1 B. Data have been digitally low-pass filtered at 20 Hz. The heavy trace denotes the response in Ringer’s solution. (C) Dependence of response duration on the time spent in 0Ca2+/0Na+ solution after the flash. Response duration was measured as the time taken after the flash for 25% recovery of current (dashed line in B). Regression line of slope 0.58 was fitted using a least-squares algorithm.
Figure 3.
Figure 3.
Collected data illustrating the dependence of the prolongation of response duration on the time spent in 0Ca2+/0Na+ solution after a bright flash as in Figs. 1 and 2. Response prolongation was measured for each cone as the difference between the time taken after the flash for the response to recover by 25% when exposed to 0Ca2+/0Na+ solution for the indicated period and the time for 25% recovery of the same cone in Ringer’s solution. (A) Mean data from seven UV-sensitive cones, as in Fig. 1; error bars represent SEM. Regression line of slope 0.43 ± 0.07 was fitted using a weighted least-squares algorithm. (B) Mean data from six blue-sensitive cones, as in Fig. 2. Regression line of slope 0.62 ± 0.05.
Figure 4.
Figure 4.
Determination of the dominant time constant from the dependence of UV-sensitive cone response duration on supersaturating flash intensity. (A and B) Superimposed suction pipette current recordings of the responses from two representative UV-sensitive cones. (A) Flashes delivered to a UV-sensitive cone in Ringer’s solution. (B) Flashes delivered to another UV-sensitive cone in 0Ca2+/0Na+ solution, without correction for the junction current. In both cases, the intensity of the 362-nm flashes increased from 1.7 × 10⁵ to 2.5 × 10⁶ photons µm−2. Each trace is the mean of two responses. (C) Mean data for the dependence of response duration on flash intensity in Ringer’s solution (protocol as in A; open circles; eight cells) and 0Ca2+/0Na+ solution measured after junction current correction (protocol as in B; closed circles; nine cells). Error bars denote SEM. Regression lines of slopes 0.38 ± 0.05 s (Ringer’s solution) and 1.04 ± 0.12 s (0Ca2+/0Na+ solution) were fitted by a weighted least-squares algorithm.
Figure 5.
Figure 5.
Determination of the dominant time constant from the dependence of blue-sensitive cone response duration on supersaturating flash intensity. (A and B) Superimposed suction pipette current recordings of the responses from two representative blue-sensitive cones. (A) Flashes delivered to a blue-sensitive cone in Ringer’s solution. (B) Flashes delivered to another blue-sensitive cone in 0Ca2+/0Na+ solution without correction for the junction current. In both cases, the intensity of the 436-nm flashes increased from 7.3 × 10⁴ to 6.1 × 10⁶ photons µm−2. Each trace is the mean of two responses. (C) Mean data for the dependence of response duration on flash intensity in Ringer’s solution (protocol as in A; open circles; 11 cells) and 0Ca2+/0Na+ solution measured after junction current correction (protocol as in B; closed circles; six cells). Error bars denote SEM. Regression lines of slopes 0.39 ± 0.04 s (Ringer’s solution) and 0.80 ± 0.15 s (0Ca2+/0Na+ solution) were fitted by a weighted least-squares algorithm.
Figure 6.
Figure 6.
Effect of pH on the responses of red-sensitive cones in the absence of light-induced changes in Ca2+ concentration. Flashes of increasing intensity were delivered in 0Ca2+/0Na+ solution buffered to pH 6.6, 7.7, 8.5, and 9.0. The left-hand panels show superimposed suction pipette current recordings of the responses without correction for the junction current from four representative cones. Each trace is the mean of two responses. Top traces represent solution change and flash command timings. Bright flashes at 578 nm were delivered between 1.1 × 10⁴ and 3.6 × 10⁶ photons µm−2 (also see right-hand panels in Fig. 7). The right-hand panels plot collected data for the mean dark current in each solution (mean ± SEM; data were collected from 9 cones at pH 6.6, 49 cones at pH 7.7, 12 cones at pH 8.5, and 16 cones at pH 9.0).
Figure 7.
Figure 7.
Effect of pH on the dominant time constant of red-sensitive cones in the absence of light-induced changes in Ca2+ concentration. Flashes of increasing intensity were delivered in 0Ca2+/0Na+ solution buffered to pH 6.6, 7.7, 8.5, and 9.0. The left-hand panels show the responses of the four representative cones of Fig. 6 after subtraction of the junction current. The top trace represents flash command timings. Dashed lines represent the 25% criterion recovery level. The closed circles in the right-hand panels plot mean data for the dependence of response duration on flash intensity in 0Ca2+/0Na+ solution buffered to the indicated pH values (error bars denote SEM; data were collected from 9 cones at pH 6.6, 49 cones at pH 7.7, 12 cones at pH 8.5, and 16 cones at pH 9.0). The open circles in B represent the corresponding relationship obtained when the flashes were delivered in Ringer’s solution at pH 7.7 (mean ± SEM; 17 cells). Regression lines were fitted using a weighted least-squares algorithm; their slopes are plotted as the dominant time constant in Fig. 8 A.
Figure 8.
Figure 8.
Dependence of the dominant time constant on pH in red-sensitive cones. (A) Dominant time constant plotted as a function of pH, obtained from the slopes of the regression lines fitted to the data of the right-hand panels of Fig. 7. Closed circles represent measurements in 0Ca2+/0Na+ solution; the open circle denotes the dominant time constant when the flash was delivered in Ringer’s solution at pH 7.7. Error bars represent SEM calculated by the weighted least-squares fitting algorithm. (B) Corresponding rate constants, calculated as the reciprocal of the dominant time constant, plotted as a function of pH. The closed circles, representing measurements in 0Ca2+/0Na+ solution, have been fitted with the modified Henderson-Hasselbalch relationship of Eq. 1 using a least-squares algorithm. The fitted curve was constrained to a maximum rate constant (Rmax) corresponding to the dominant time constant measured in Ringer’s solution (open circle and dashed line), yielding a pK of 7.1 ± 0.1 and a minimum baseline rate, B, at a high pH of 0.22 ± 0.04.
Figure 9.
Figure 9.
Lack of effect of pH on the dominant time constant of salamander rods in the absence of light-induced changes in Ca2+ concentration. Flashes of increasing intensity were delivered in 0Ca2+/0Na+ solution buffered to pH 6.6, 7.6, and 8.6. Bright flashes at 500 nm were delivered between 6.7 and 111 photons µm−2 and were presented in a time-symmetrical sequence. The left-hand panels show the responses of three representative rods after subtraction of the junction current. Each trace is the mean of two responses to flashes presented symmetrically in time and has been normalized according to the initial current just before the flash. The top trace represents flash command timings. The closed circles in the middle panels plot the dependence of response duration on flash intensity for each cell; each point is the mean of the values from two symmetrically presented responses. Regression lines were fitted using a least-squares algorithm; their slopes represent the dominant time constant in each cell. The right-hand panel plots collected data from several cells for the mean value of the time constant fitted individually to each cell at pH 6.6 (seven cells), pH 7.6 (eight cells), and pH 8.6 (six cells); error bars represent the SEM. The time constants are not significantly different at the three pH values (one-way ANOVA; F = 1.05, P = 0.37), indicating that external pH has no systematic effect on the dominant time constant in rods.
Figure 10.
Figure 10.
Possible sites at which changes in pH might influence the salamander red cone pigment. (A) Recording configuration used to record from red cone photoreceptors. The suction pipette was filled with normal Ringer’s solution, whereas the outer segment was briefly exposed to 0Ca2+/0Na+ solution of altered pH. Note that the photopigment molecule spans the invaginated cone outer segment membrane, with the consequence that its extracellular (N terminal) face is in contact with the modified bathing solution. (B) Schematic representation of the predicted secondary structure of the salamander red cone pigment (modified from Xu et al., 1998) showing sites known to interact with protons. Numbers denote opsin transmembrane helices. ERY, motif containing a conserved carboxylic acid residue, believed to stabilize the activated Meta IIb form of the pigment (Mahalingam et al., 2008). Glu, conserved glutamine that acts as the counterion for the protonated Schiff base (Jaeger et al., 1994). His, histidine residue conserved in long wavelength cone pigments and believed to constitute the anion-binding site (Wang et al., 1993). (C) Schematic representation of the reactions underlying photopigment activation, modified from the schema for rhodopsin (Mahalingam et al., 2008), indicating the potential involvement of proton binding at the aforementioned sites.

Similar articles

Cited by

References

    1. Arinobu D., Tachibanaki S., Kawamura S. 2010. Larger inhibition of visual pigment kinase in cones than in rods. J. Neurochem. 115:259–268 10.1111/j.1471-4159.2010.06925.x - DOI - PubMed
    1. Arnis S., Fahmy K., Hofmann K.P., Sakmar T.P. 1994. A conserved carboxylic acid group mediates light-dependent proton uptake and signaling by rhodopsin. J. Biol. Chem. 269:23879–23881 - PubMed
    1. Arshavsky V.Y., Bownds M.D. 1992. Regulation of deactivation of photoreceptor G protein by its target enzyme and cGMP. Nature. 357:416–417 10.1038/357416a0 - DOI - PMC - PubMed
    1. Baylor D.A., Hodgkin A.L. 1974. Changes in time scale and sensitivity in turtle photoreceptors. J. Physiol. 242:729–758 - PMC - PubMed
    1. Bownds D., Dawes J., Miller J., Stahlman M. 1972. Phosphorylation of frog photoreceptor membranes induced by light. Nat. New Biol. 237:125–127 - PubMed

Publication types