. 2012 Jul 15;26(14):1533-45.
doi: 10.1101/gad.184911.111.

E2F7, a novel target, is up-regulated by p53 and mediates DNA damage-dependent transcriptional repression

Affiliations

E2F7, a novel target, is up-regulated by p53 and mediates DNA damage-dependent transcriptional repression

Luis A Carvajal et al. Genes Dev. .

Abstract

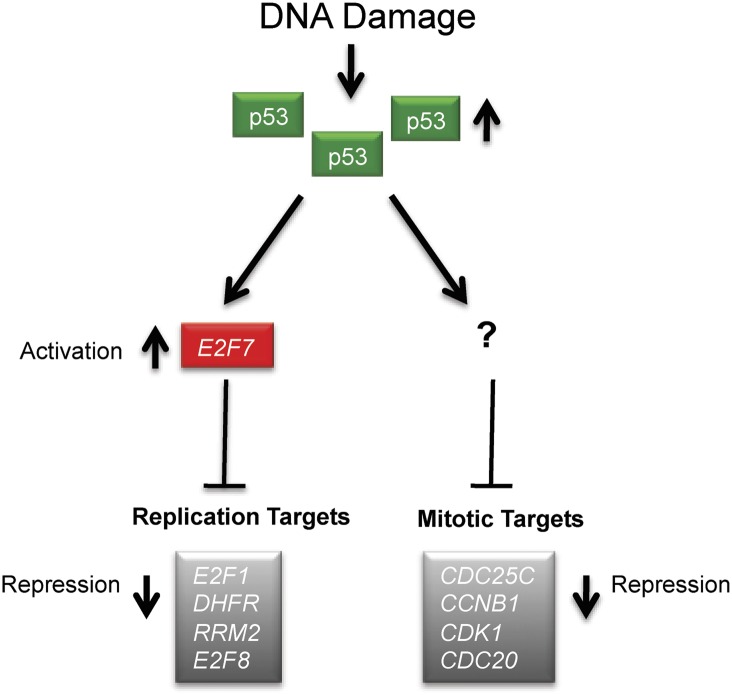
The p53 tumor suppressor protein is a transcription factor that exerts its effects on the cell cycle via regulation of gene expression. Although the mechanism of p53-dependent transcriptional activation has been well-studied, the molecular basis for p53-mediated repression has been elusive. The E2F family of transcription factors has been implicated in regulation of cell cycle-related genes, with E2F6, E2F7, and E2F8 playing key roles in repression. In response to cellular DNA damage, E2F7, but not E2F6 or E2F8, is up-regulated in a p53-dependent manner, with p53 being sufficient to increase expression of E2F7. Indeed, p53 occupies the promoter of the E2F7 gene after genotoxic stress, consistent with E2F7 being a novel p53 target. Ablation of E2F7 expression abrogates p53-dependent repression of a subset of its targets, including E2F1 and DHFR, in response to DNA damage. Furthermore, E2F7 occupancy of the E2F1 and DHFR promoters is detected, and expression of E2F7 is sufficient to inhibit cell proliferation. Taken together, these results show that p53-dependent transcriptional up-regulation of its target, E2F7, leads to repression of relevant gene expression. In turn, this E2F7-dependent mechanism contributes to p53-dependent cell cycle arrest in response to DNA damage.


Figures

Figure 1.
Figure 1.
DNA damage induces p53-dependent transcriptional repression of cell cycle genes and up-regulates E2F7 mRNA and protein. (A) qRT–PCR using mRNA extracted from HCT116 p53+/+ and p53−/− cells before and after treatment with the DNA-damaging agent doxorubicin. Expression analysis of a subset of genes involved in cell cycle regulation was evaluated at different time points after treatment. (B) Immunoblot analysis using whole-cell extracts from U2OS (p53+/+) cells before and after treatment with increasing amounts of doxorubicin. Protein expression of E2F7, p53, p21, and Actin was detected with specific antibodies. (C) qRT–PCR expression analysis of E2F6, E2F7, and E2F8 in HCT116 (p53+/+) and U2OS (p53+/+) cells nontreated and treated with doxorubicin. (D) Immunoblot analysis using whole-cell extracts from U2OS (p53+/+) cells before and after treatment with increasing amounts of the DNA-damaging agent etoposide. Protein expression analysis was conducted as in B. (E) qRT–PCR expression analysis of E2F1, E2F7, and E2F8 using mRNA extracted from U2OS cells nontreated and treated with etoposide as in D. Bar graphs represent the average of three independent experiments. (NT) Nontreated; (D) days, Error bars indicate the standard error of the mean (SEM); statistical significance is shown using the Student's t-test analysis. (**) P < 0.01; (*) P < 0.05; (n.s.) not significant.
Figure 2.
Figure 2.
E2F7 is up-regulated in a p53-dependent manner in response to either Nutlin3a treatment or ectopic expression of p53. (A) Immunoblot analysis of E2F7, p53, p21, and Actin expression using cell extracts from U2OS cells nontreated and treated with increasing amounts of the Mdm2 inhibitor Nutlin3a. (B) Cell cycle profile using flow cytometry of corresponding samples in A. (C) qRT–PCR expression analysis of TP53, CDKN1A, E2F6, E2F7, and E2F8 using mRNA extracted from U2OS p53+/+ cells nontreated or treated with increasing amounts of Nutlin3a. (D) Immunoblot analysis of p53 levels using the EJ cell line, which was engineered to ectopically express p53 under the control of a tetracycline-repressible system. (E) Cell cycle profile analysis of each corresponding sample in D before and after removal of tetracycline from cells in culture. (F) qRT–PCR expression analysis of the same target genes used in C from each corresponding EJp53 sample shown in D and E. The average of three independent experiments is shown. (NT) Nontreated; (T) tetracycline. Error bars indicate the standard error of the mean. Statistical significance is shown using the Student's t-test analysis; (**) P < 0.01; (*) P < 0.05; (n.s.) not significant.
Figure 3.
Figure 3.
DNA damage-induced E2F7 up-regulation is p53-dependent. (A) U2OS cells were used to silence p53 expression via a siRNA approach. Cells transfected with either control (Ctl) or p53 siRNA oligonucleotides were treated with doxorubicin 24 h after transfection. mRNA was extracted from each sample and processed for gene expression analysis of E2F7, CDKN1A, and TP53 by qRT–PCR. (B) HCT116 p53+/+ or p53−/− cells were treated with doxorubicin and processed for gene expression analysis of E2F7 and CDKN1A. Immunoblot analysis showing p53 expression levels from each corresponding sample shown in C. (NT) Nontreated; (D) days. Error bars indicate the standard error of the mean. Statistical significance is shown using the Student's t-test analysis; (**) P < 0.01; (*) P < 0.05; (n.s.) not significant. The average of three independent experiments is shown.
Figure 4.
Figure 4.
p53 is recruited to the E2F7 promoter via a putative p53-binding site. (A) Schematic of the E2F7 promoter is shown with a consensus p53 response element. (RE) Response element; (R) purine; (Y) pyrimidine; (W) A or T; (arrows) forward and reversed primers. (B) H1299 (p53-null) cells were transfected with either a control empty vector (CMV), a wild-type p53 (WT), or a mutant p53 (Δ24). Transfected samples were collected 24 h after transfection and processed for ChIP using a p53 monoclonal antibody. Genomic DNA was isolated and analyzed by qPCR using genomic DNA primers surrounding the p53RE as depicted in A. Primers in the albumin and CDKN1A promoters were used as a negative and positive control, respectively. Immunoblot analysis showing the relative expression of p53 after transfection is shown to the right of B. (C) HCT116 (p53+/+) cells in culture were treated with doxorubicin for 24 h and processed for ChIP using a p53 monoclonal antibody or GFP antibody as a control. Genomic DNA was isolated and analyzed as in B. (D) H1299 (p53-null) cells were transfected with an E1b-TATA luciferase reporter (E1b-TATA-p53RE) containing a p53 response element from the E2F7 promoter and increasing amounts of either wild-type p53 (WT) or a DNA-binding mutant p53 (248H). Empty E1b-TATA luciferase and E1b-TATA containing a CDKN1A (p21) minimal promoter with an isolated p53 response element (E1b-TATA-5′ p21P) were used as negative and positive control, respectively. (NT) Nontreated; (Dox) doxorubicin. Error bars indicate the standard error of the mean. Statistical significance is shown using the Student's t-test analysis; (**) P < 0.01; (*) P < 0.05; (n.s.) not significant. The average of three independent experiments is shown.
Figure 5.
Figure 5.
DNA damage-induced transcriptional repression of replication targets, but not mitotic targets, is E2F7-dependent. (A) Immunoblot analysis of E2F7, E2F1, Cdc25C, and p53 protein levels. E2F7 expression was targeted for degradation in U2OS cells using a siRNA approach. Cells in culture transfected with either control (Ctl) or E2F7 siRNA oligonucleotides were treated with 0.1 μg/mL doxorubicin 24 h after transfection and harvested at the indicated time point; (D) days. qRT–PCR expression analysis of E2F7 and CDKN1A is shown in B, and that of CDC25C, CCNB1, CDK1, E2F1, RRM2, and DHFR is shown in C from each corresponding sample in A. (NT) Nontreated; (D) days. Error bars indicate the standard error of the mean. Statistical significance is shown using the Student's t-test analysis; (*) P < 0.01; (*) P < 0.05; (n.s.) not significant. The average of three independent experiments is shown.
Figure 6.
Figure 6.
E2F7 is anti-proliferative and binds specifically to the E2F1 and DHFR promoters. (A) U2OS cells were transfected with increasing amounts of either empty pcDNA3 vector or a Flag-tagged E2F7-expressing pcDNA3 vector. Immunoblot analysis of transfected U2OS cells shows the relative expression levels of Flag-E2F7 in cells. (B) Colony formation assay of U2OS cells cotransfected with pBabe-Puro and either empty pcDNA3 vector or Flag-tagged E2F7-expressing vector. pBabe-Puro was used as a selection marker. The bar graph shows the average of three independent colony formation experiments. (C) Colony formation assay of H1299 (p53-null) cells cotransfected with pBabe-Puro and either empty pcDNA3 vector, Flag-tagged E2F7-expressing vector, or Flag-tagged wild-type p53-expressing vector. pBabe-puro was used as a selection marker. The bar graph shows the average of three independent colony formation experiments. (D) H1299 (p53-null) cells were transfected with 2 μg of pcDNA3-Flag E2F7 or empty pcDNA3. Cells were harvested 24 h after transfection and processed for ChIP using an anti-Flag antibody. Immunopurified genomic DNA fragments were analyzed for Flag-E2F7 enrichment at the indicated promoters by qPCR. (B–D) Error bars indicate the standard error of the mean. Statistical significance is shown using the Student's t-test analysis; (**) P < 0.01; (*) P < 0.05; (n.s.) not significant. The average of three independent experiments is shown. (E) HCT116 (p53+/+) cells were treated with doxorubicin for 24 h and processed for ChIP using a polyclonal E2F7 antibody or no antibody as a control. Immunopurified genomic DNA fragments were analyzed for endogenous E2F7 enrichment at the indicated promoters by qPCR. Primers in the albumin promoter were used as a negative control. (NT) Nontreated. The average of two independent experiments is shown.
Figure 7.
Figure 7.
Model: E2F7 is a novel p53 target and mediates transcriptional repression of replication target genes in response to DNA damage. DNA damage induces transcriptional repression of genes involved in DNA replication and mitotic progression in a p53-dependent manner. E2F7 is a novel p53 target gene up-regulated in response to DNA damage. E2F7 binds specifically to replication target gene promoters and mediates DNA damage-induced transcriptional repression. Mitotic target genes are repressed via a different mechanism, and E2F7 does not appear to play a role.

References

    1. Badie C, Itzhaki JE, Sullivan MJ, Carpenter AJ, Porter AC 2000. Repression of CDK1 and other genes with CDE and CHR promoter elements during DNA damage-induced G(2)/M arrest in human cells. Mol Cell Biol 20: 2358–2366 - PMC - PubMed
    1. Barsotti AM, Prives C 2010. Noncoding RNAs: The missing ‘linc’ in p53-mediated repression. Cell 142: 358–360 - PubMed
    1. Beckerman R, Prives C 2010. Transcriptional regulation by p53. Cold Spring Harb Perspect Biol 2: a000935 doi: 10.1101/cshperspect.a000935 - PMC - PubMed
    1. Brady CA, Jiang D, Mello SS, Johnson TM, Jarvis LA, Kozak MM, Broz DK, Basak S, Park EJ, Mclaughlin ME, et al. 2011. Distinct p53 transcriptional programs dictate acute DNA-damage responses and tumor suppression. Cell 145: 571–583 - PMC - PubMed
    1. Cartwright P, Müller H, Wagener C, Holm K, Helin K 1998. E2F-6: A novel member of the E2F family is an inhibitor of E2F-dependent transcription. Oncogene 17: 611–623 - PubMed

Publication types

MeSH terms