. 2012 Jul 15;26(14):1546-57.
doi: 10.1101/gad.196238.112.

The atypical E2F family member E2F7 couples the p53 and RB pathways during cellular senescence

Affiliations

The atypical E2F family member E2F7 couples the p53 and RB pathways during cellular senescence

Ozlem Aksoy et al. Genes Dev. .

Abstract

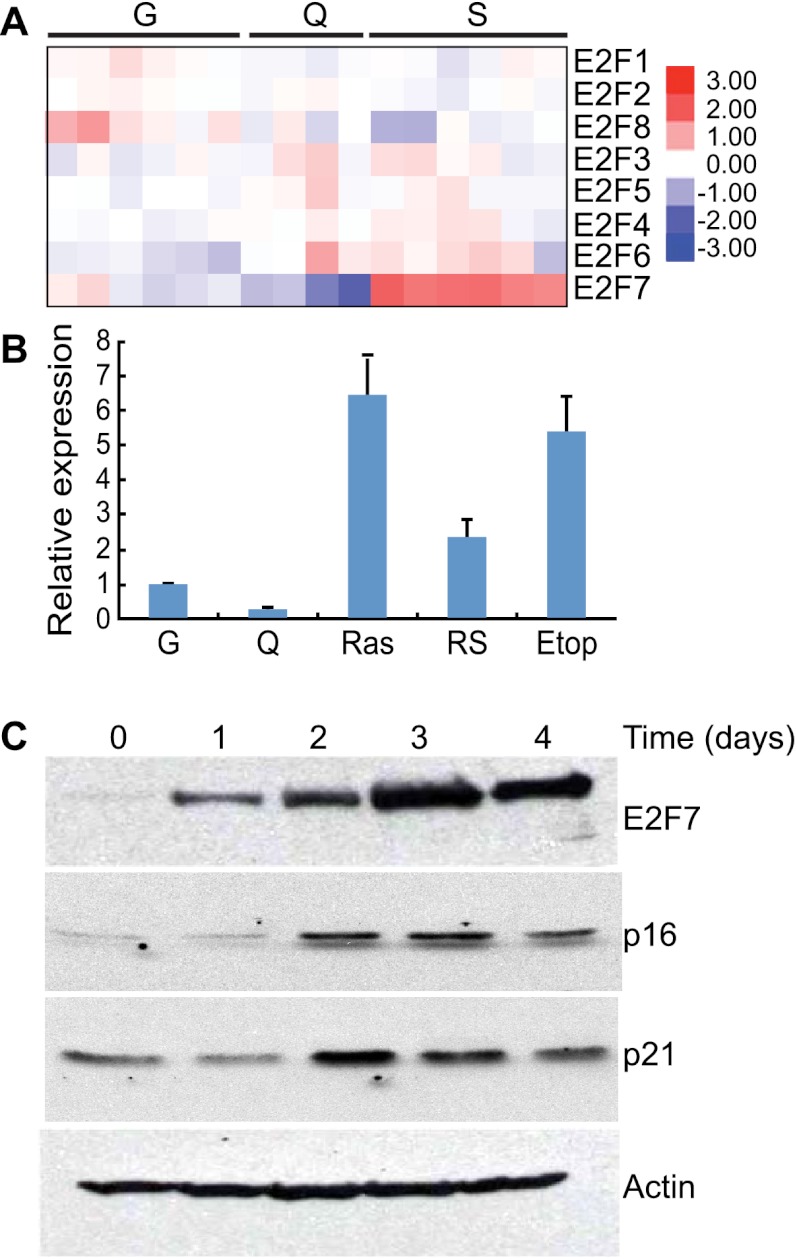
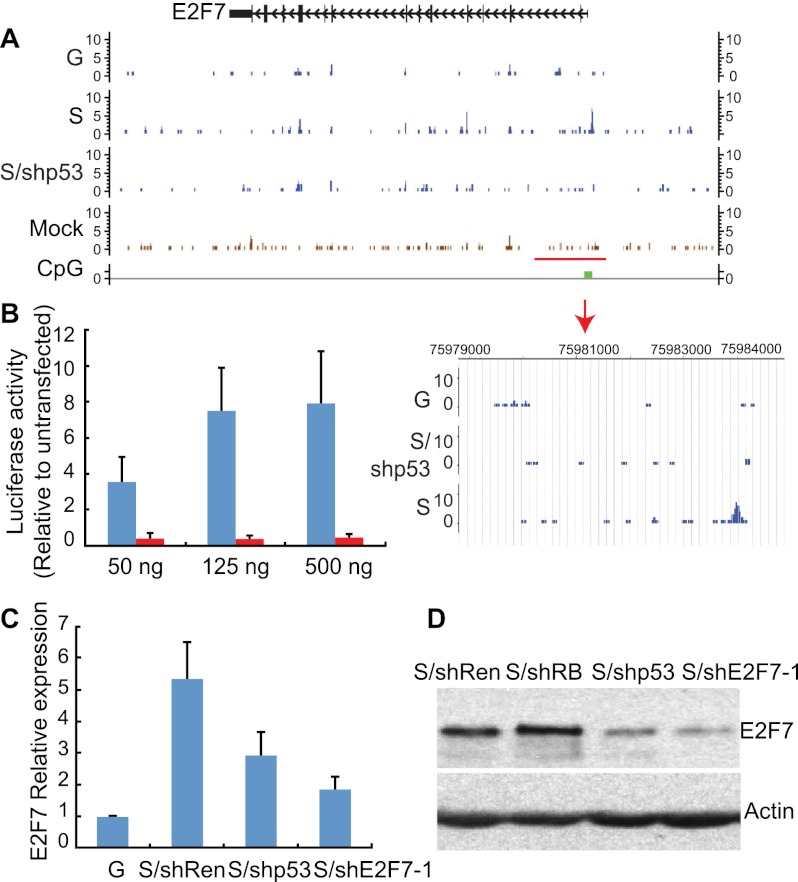
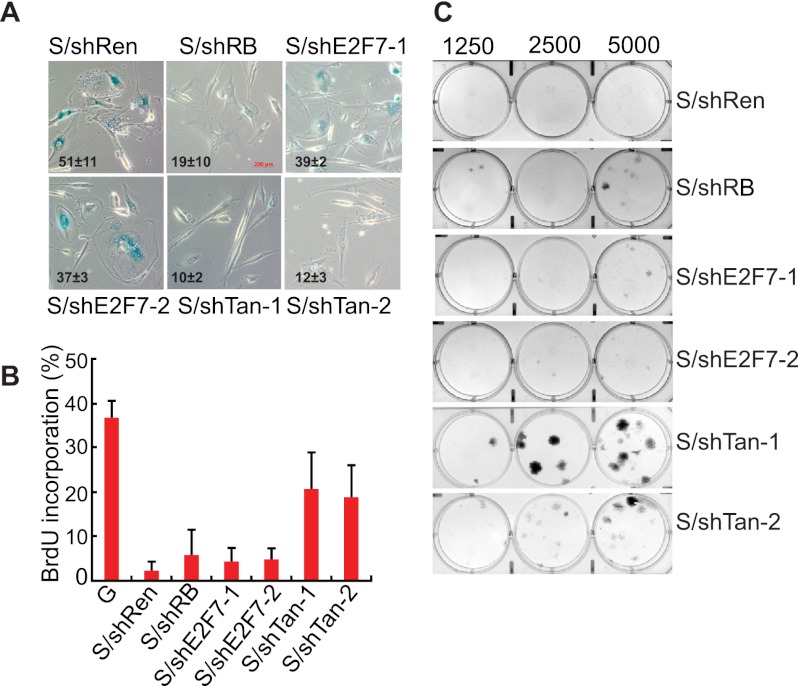
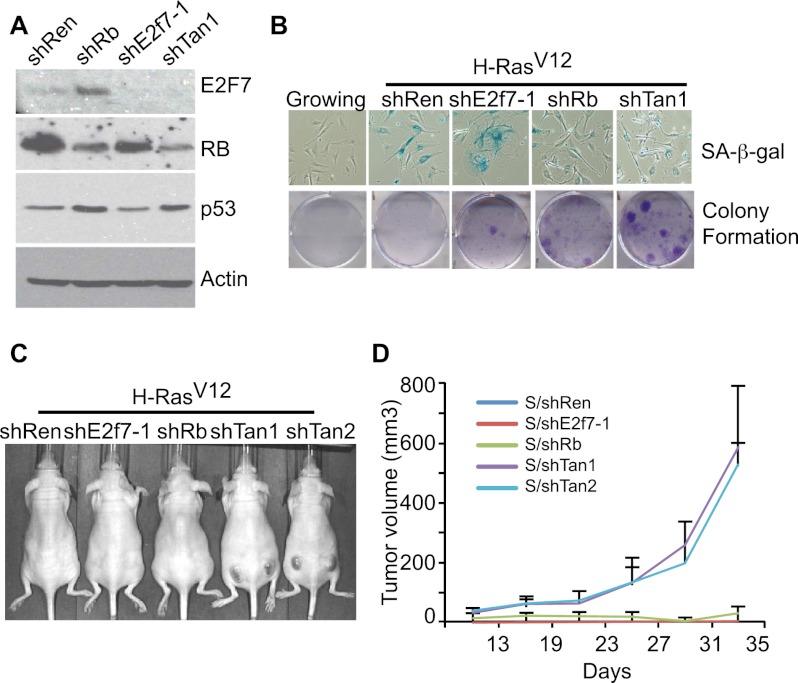
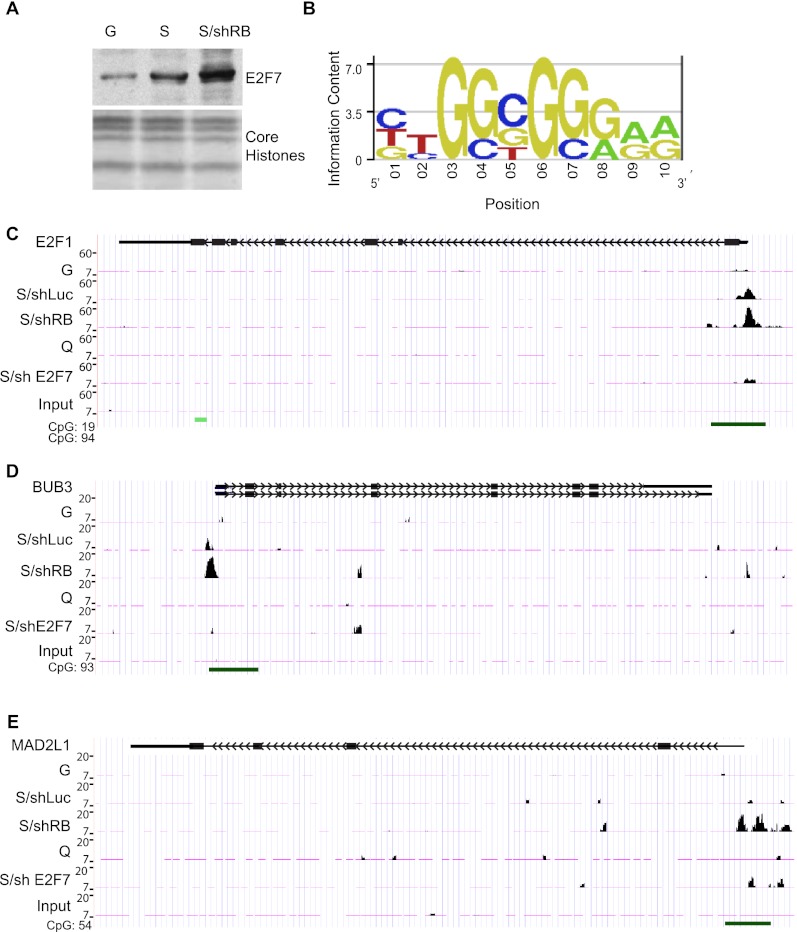
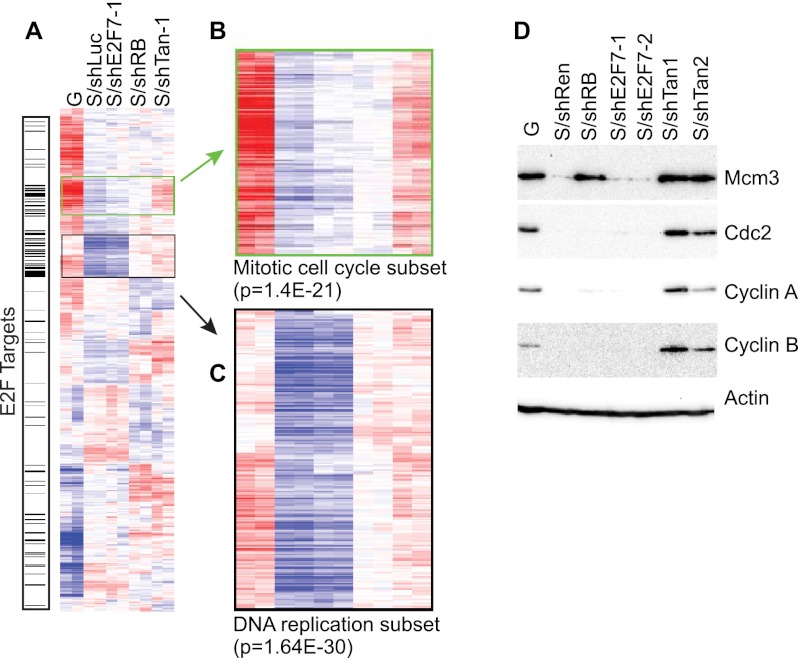
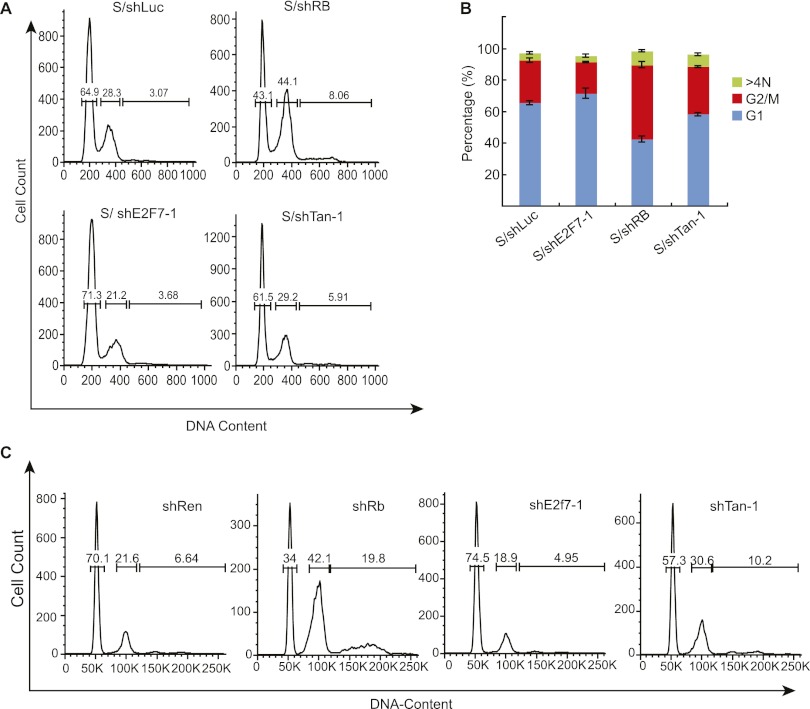
Oncogene-induced senescence is an anti-proliferative stress response program that acts as a fail-safe mechanism to limit oncogenic transformation and is regulated by the retinoblastoma protein (RB) and p53 tumor suppressor pathways. We identify the atypical E2F family member E2F7 as the only E2F transcription factor potently up-regulated during oncogene-induced senescence, a setting where it acts in response to p53 as a direct transcriptional target. Once induced, E2F7 binds and represses a series of E2F target genes and cooperates with RB to efficiently promote cell cycle arrest and limit oncogenic transformation. Disruption of RB triggers a further increase in E2F7, which induces a second cell cycle checkpoint that prevents unconstrained cell division despite aberrant DNA replication. Mechanistically, E2F7 compensates for the loss of RB in repressing mitotic E2F target genes. Together, our results identify a causal role for E2F7 in cellular senescence and uncover a novel link between the RB and p53 pathways.


Figures

Figure 1.
Figure 1.
E2F7 is up-regulated during cellular senescence. (A) Heat map of the expression patterns of E2F family members in growing (G), quiescent (Q), and senescent (S) IMR90 cells. Each row represents a biological replicate. (B) Histogram showing the levels of E2F7 RNA in either growing (G) or quiescent (Q) cells or cells triggered to undergo senescence by either RasV12 (Ras), replicative exhaustion (RS, passage 34), or etoposide (Etop, 100 uM). The quantity of RNA was measured by real-time qPCR analysis (qPCR), normalized to the expression of β-actin, and expressed as fold change relative to growing IMR90 cells. The data represent the mean (±the standard deviation) of three separate experiments. (C) Immunoblots documenting the increase in E2F7 protein in cells undergoing senescence. Protein lysates were from ER-Ras-infected IMR90 cells at the indicated time after 4-hydroxy-tamoxifen (4-OHT) treatment. Accumulation of p16INK4A and p21CDKN1A are shown as an indication of Ras activation upon tamoxifen treatment. Actin probing of a parallel blot was used as a loading control.
Figure 2.
Figure 2.
E2F7 is a bona fide p53 target gene. (A) Binding patterns of p53 to the E2F7 gene promoter shown as custom tracks on the University of California at Santa Cruz (UCSC) Genome Browser. p53-specific peaks are detected in the promoter of the E2F7 gene (see magnified image of the highlighted area below) specifically in senescent cells (S) but not growing cells (G) or senescent cells expressing a p53 shRNA (S/shp53). Peaks detected outside the promoter are insensitive to suppression of p53, suggesting that they are not specific. (B) Histogram showing the luciferase activity induced by the indicated amount of p53 on the reporter gene driven by the p53 response element from the E2F7 gene. Luciferase activity was plotted as the induction relative to basal luciferase activity. The data represent the mean (±the standard deviation) of three separate experiments. (C) Histogram showing the levels of E2F7 RNA in growing or senescent cells expressing the indicated shRNA. Expression is normalized to the expression of GAPDH and is presented as the fold change relative to growing IMR90 cells. Values are means ± standard deviation of three independent samples. (D) Immunoblot showing the levels of the E2F7 protein in senescent cells expressing the indicated shRNA. Actin was used as loading control. The figure is a representative blot of at least three independent experiments.
Figure 3.
Figure 3.
E2F7 cooperates with RB to promote senescence. (A) Micrographs showing SA-β-gal staining in senescent cells expressing the indicated shRNAs. The numbers shown at the bottom left of each micrograph represent the quantitation of SA-β-gal-positive cells. The data represent means ± standard deviation of three independent experiments. shE2F7-1 and shE2F7-2 are two independent shRNAs targeting E2F7. The same two shRNAs were used in combination with shRB (shTan1 and shTan2). An shRNA targeting Renilla is a neutral control shRNA. Bar, 200 μm. (B) Quantification of BrdU incorporation in senescent IMR90 cells expressing the indicated shRNAs. The data represent means ± standard deviation of three independent experiments. Growing (G) cells were used as a control. (C) Colony formation assay documenting the effect of suppressing RB and E2F7 on the ability of H-RasV12 expressing IMR90 cells to grow at low density. Shown are representative crystal violet stainings of 6-cm plates 2 wk after plating.
Figure 4.
Figure 4.
Cosuppression of RB and E2F7 promotes transformation. (A) Immunoblots from lysates of mouse liver progenitor cells documenting the efficiency of the indicated shRNAs in suppressing RB and E2F7. shTan is the bicistronic shRNA targeting RB and E2F7, and shRen is a neutral control shRNA. Actin was used as a loading control. (B, top) Micrographs showing SA-β-gal staining in MEFs undergoing senescence in the presence of the indicated shRNAs. Growing cells were used as a control. (Bottom) Colony formation assays documenting the effect of suppressing RB and E2F7 on the ability of H-RasV12-expressing MEFs to grow at low density. Shown are representative crystal violet stainings of 6-cm plates 2 wk after plating. (C) Representative images of immunocompromised mice 20 d after subcutaneous injections of 1 × 10⁶ MEFs expressing H-Ras and the indicated shRNA. Tan1 and Tan2 are two different hairpins targeting both RB and E2F7. (D) Quantification of tumor volumes. Each point represents mean tumor volume ± SEM (n = 6). Tumor size was measured once a week.
Figure 5.
Figure 5.
E2F7 binds to a subset of E2F targets during senescence. (A) Immunoblot showing E2F7 protein levels in chromatin-bound fractions of growing (G), senescent (S), or shRB-expressing senescent (S/shRB) IMR90 cells. Core histones were used as loading control. (B) Position weight matrix of the motif significantly enriched in the DNA associated with E2F7. This sequence is highly similar to the E2F motif (TTTCGCGC). (C) Binding patterns of E2F7 to the E2F1 gene promoter shown as custom tracks on the UCSC Genome Browser. The green bar at the bottom of the figure corresponds to CpG islands in the promoter of the E2F1 gene. Notice the increase in E2F7 binding in senescent cells with or without RB expression compared with growing and quiescent conditions. (D,E) Binding patterns of E2F7 to the BUB3 and MADL2 gene promoters shown as custom tracks on the UCSC Genome Browser. Notice the increase in E2F7 binding in senescent cells suppressed for RB (shRB). (G) Growing; (S) senescent; (shRB) shRNA against RB.
Figure 6.
Figure 6.
E2F compensates for RB in controlling gene expression during senescence. (A) Heat map of the expression patterns derived from average-linked clustering of differentially expressed genes among various groups (P < 0.001; 2486 probes) highlighting the E2F target genes. (B,C) Magnification of gene clusters. (B) Mitotic cell cycle gene clusters. (C) DNA replication factors clusters. (D) Immunoblots for representative DNA replication (MCM3) or mitotic cell cycle (CDC2, Cyclin A, and Cyclin B) proteins. Actin was used as a loading control. (G) Growing; (S) H-RasV12-expressing cells.
Figure 7.
Figure 7.
E2F7 enforces a second cell cycle checkpoint that backs up RB. (A) Cell cycle profiles of IMR90 cells undergoing senescence in the presence of the indicated shRNA. The X axis shows the DNA content, whereas the Y axis shows the number of cells. (B) Bar graph showing the percentages for G1 and G2/M cells. The data shown are the mean value ± standard deviation from three independent experiments. (C) Cell cycle profiles of hepatoblasts triggered to undergo senescence by reactivation of p53 in the presence of the indicated shRNAs. The DNA content was measured by flow cytometry 8 d after doxycycline treatment.

References

    1. Aslanian A, Iaquinta PJ, Verona R, Lees JA 2004. Repression of the Arf tumor suppressor by E2F3 is required for normal cell cycle kinetics. Genes Dev 18: 1413–1422 - PMC - PubMed
    1. Attwooll C, Oddi S, Cartwright P, Prosperini E, Agger K, Steensgaard P, Wagener C, Sardet C, Moroni MC, Helin K 2005. A novel repressive E2F6 complex containing the polycomb group protein, EPC1, that interacts with EZH2 in a proliferation-specific manner. J Biol Chem 280: 1199–1208 - PubMed
    1. Azzoli CG, Sagar M, Wu A, Lowry D, Hennings H, Morgan DL, Weinberg WC 1998. Cooperation of p53 loss of function and v-Ha-ras in transformation of mouse keratinocyte cell lines. Mol Carcinog 21: 50–61 - PubMed
    1. Beausejour CM, Krtolica A, Galimi F, Narita M, Lowe SW, Yaswen P, Campisi J 2003. Reversal of human cellular senescence: Roles of the p53 and p16 pathways. EMBO J 22: 4212–4222 - PMC - PubMed
    1. Braig M, Lee S, Loddenkemper C, Rudolph C, Peters AH, Schlegelberger B, Stein H, Dörken B, Jenuwein T, Schmitt CA 2005. Oncogene-induced senescence as an initial barrier in lymphoma development. Nature 436: 660–665 - PubMed

Publication types