. 2012 Jul 31;109(31):12644-9.
doi: 10.1073/pnas.1209227109. Epub 2012 Jul 16.

Transcriptional consequences of aneuploidy

Affiliations

Transcriptional consequences of aneuploidy

Jason M Sheltzer et al. Proc Natl Acad Sci U S A. .

Abstract

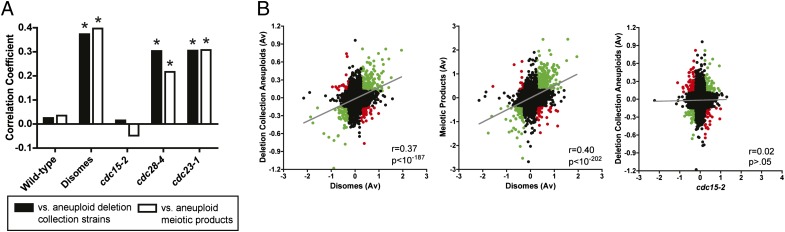
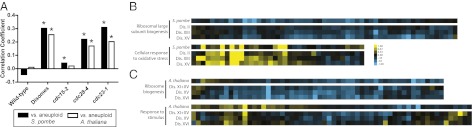
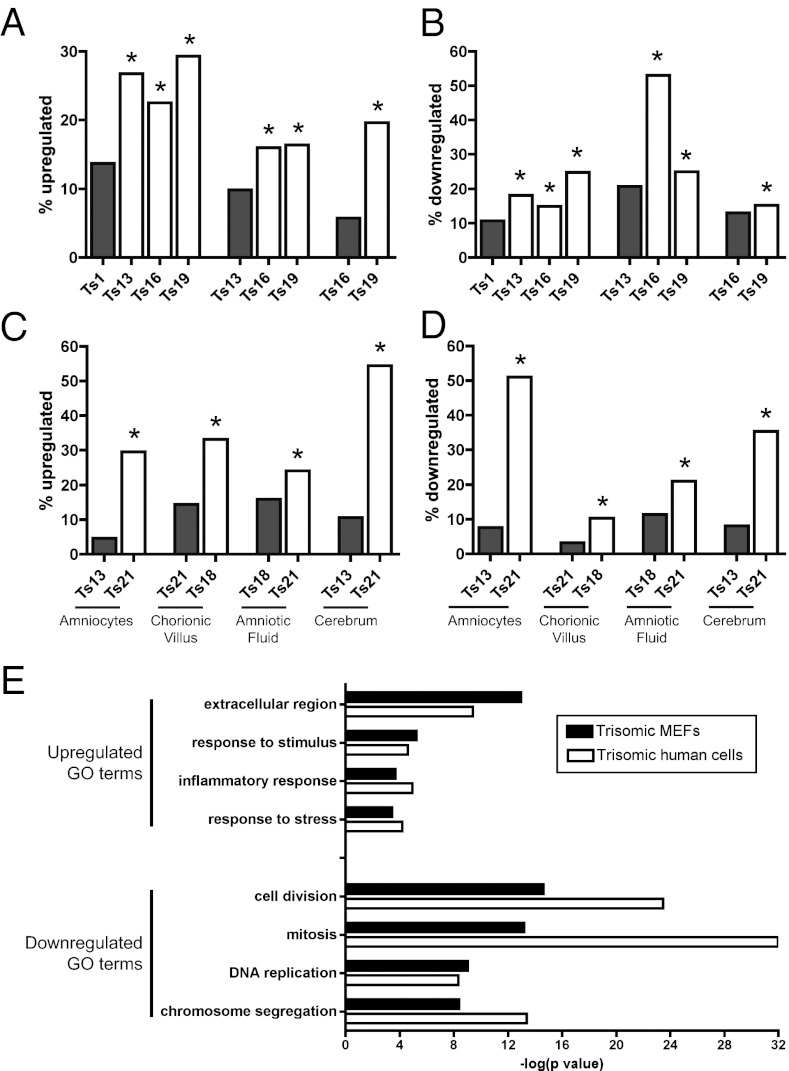
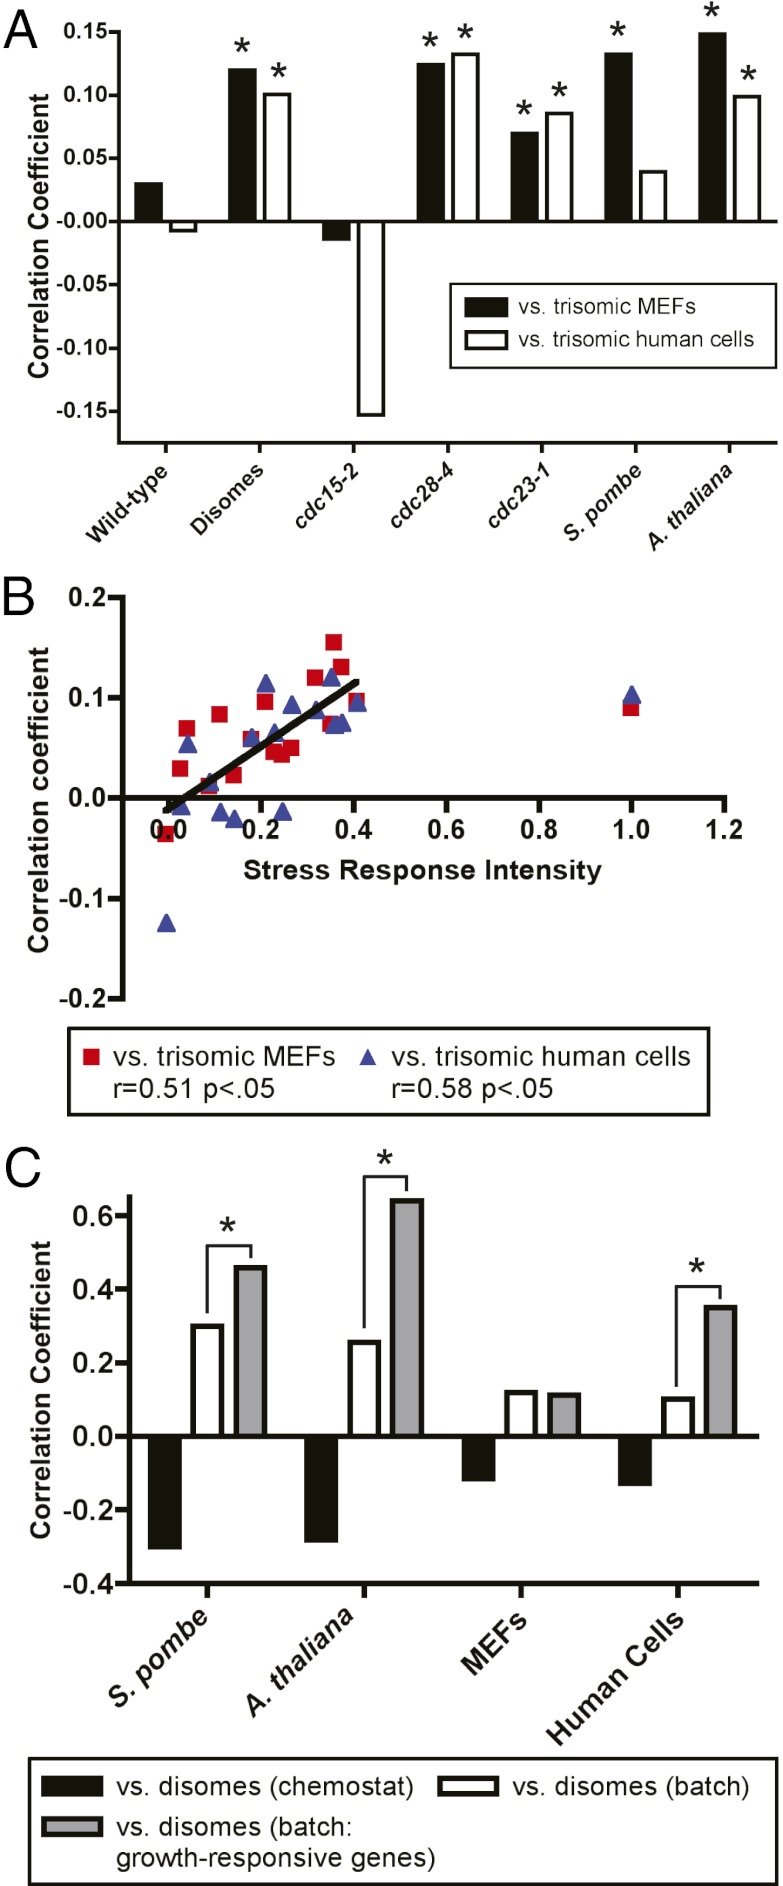
Aneuploidy, or an aberrant karyotype, results in developmental disabilities and has been implicated in tumorigenesis. However, the causes of aneuploidy-induced phenotypes and the consequences of aneuploidy on cell physiology remain poorly understood. We have performed a metaanalysis on gene expression data from aneuploid cells in diverse organisms, including yeast, plants, mice, and humans. We found highly related gene expression patterns that are conserved between species: genes that were involved in the response to stress were consistently upregulated, and genes associated with the cell cycle and cell proliferation were downregulated in aneuploid cells. Within species, different aneuploidies induced similar changes in gene expression, independent of the specific chromosomal aberrations. Taken together, our results demonstrate that aneuploidies of different chromosomes and in different organisms impact similar cellular pathways and cause a stereotypical antiproliferative response that must be overcome before transformation.


Conflict of interest statement

The authors declare no conflict of interest.

Figures

Fig. 1.
Fig. 1.
Transcriptional similarities among aneuploid strains of S. cerevisiae. (A) The correlation coefficients between either aneuploid strains from the yeast deletion collection (black bars) or aneuploid products of triploid meiosis (white bars) and the indicated strains of S. cerevisiae are displayed. Asterisks denote statistically significant correlations (P < 0.05). (B) Scatter plots comparing gene expression values between the indicated yeast strains. Points in green represent genes that are expressed ±1 SD from the mean codirectionally, and points in red represent genes that are expressed ±1 SD in opposite directions. Gray lines are linear regressions plotted against the data.
Fig. 2.
Fig. 2.
Aneuploidy causes a stress response in S. pombe and A. thaliana. (A) The correlation coefficients between aneuploid strains of either S. pombe (black bars) or A. thaliana (white bars) and the indicated strains of S. cerevisiae are displayed. (B and C) Heat maps of orthologous genes annotated to aneuploidy-related GO terms from aneuploid strains of (B) S. pombe or (C) A. thaliana and the indicated disomes are displayed.
Fig. 3.
Fig. 3.
Aneuploidy causes similar transcriptional changes in primary mouse and human cells. (A and B) Genes up- or downregulated in one trisomic MEF line are significantly more likely to exhibit a similar change in another trisomy. Gray bars indicate the percentage of all genes up- or downregulated in the indicated cell line at a 1.5-FC cutoff. White bars indicate the percentage of genes up- or downregulated in that trisomy that are also up- or downregulated in the trisomy represented with a gray bar. Asterisks indicate statistically significant overlap (P < 0.05, hypergeometric test). (C and D) Genes up- or downregulated in one trisomic human type are significantly more likely to exhibit a similar change in another trisomy from the same tissue of origin. Data from cultured amniocytes and chorionic villi are from (44). Data from fetal cerebra are from (45). Data from cell-free amniotic fluid are from (31) and (46). (E) GO terms that are enriched among up- and downregulated genes in trisomic MEFs and human cells. Complete lists are presented in Tables S7 and S9.
Fig. 4.
Fig. 4.
Transcriptional similarities among all aneuploid cell types. (A) Correlation coefficients between the indicated cell type and either trisomic MEFs (black bars) or cultured trisomic human cells (white bars) are displayed. Asterisks indicate a statistically significant correlation (P < 0.05). (B) The stress-response intensity of the disomic strains is plotted against the pairwise correlations with the trisomic mouse and human cells. The black line is a linear regression plotted against the data excluding disome IV (SRI∼1). (C) Correlation coefficients between the indicated aneuploid cell types and chemostat-grown disomes (black bars), batch-grown disomes (white bars), and 500 growth-responsive genes in batch-grown disomes (gray bars) are displayed.

References

    1. Musacchio A, Salmon ED. The spindle-assembly checkpoint in space and time. Nat Rev Mol Cell Biol. 2007;8:379–393. - PubMed
    1. Weaver BA, Cleveland DW. Does aneuploidy cause cancer? Curr Opin Cell Biol. 2006;18:658–667. - PubMed
    1. Hassold T, et al. Human aneuploidy: Incidence, origin, and etiology. Environ Mol Mutagen. 1996;28:167–175. - PubMed
    1. Brown S. Miscarriage and its associations. Semin Reprod Med. 2008;26:391–400. - PubMed
    1. Delabar JM, et al. Molecular mapping of twenty-four features of Down syndrome on chromosome 21. Eur J Hum Genet. 1993;1:114–124. - PubMed

Publication types

Associated data