. 2012 Jul 31;109(31):12544-9.
doi: 10.1073/pnas.1209620109. Epub 2012 Jul 16.

Epigenetic stability, adaptability, and reversibility in human embryonic stem cells

Affiliations

Epigenetic stability, adaptability, and reversibility in human embryonic stem cells

Joshua D Tompkins et al. Proc Natl Acad Sci U S A. .

Abstract

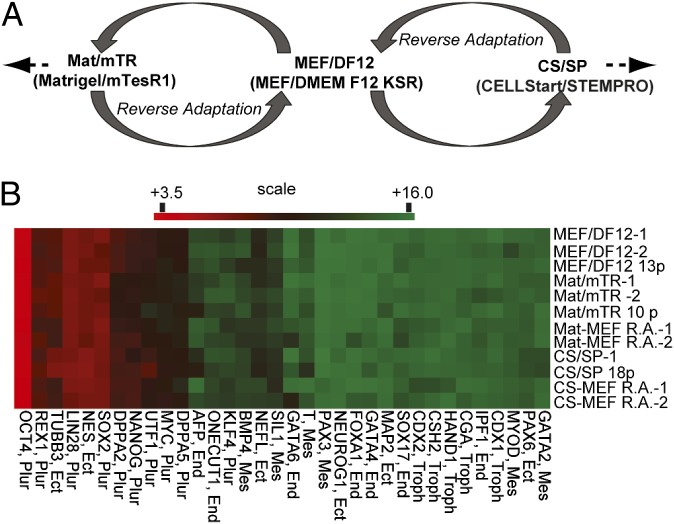
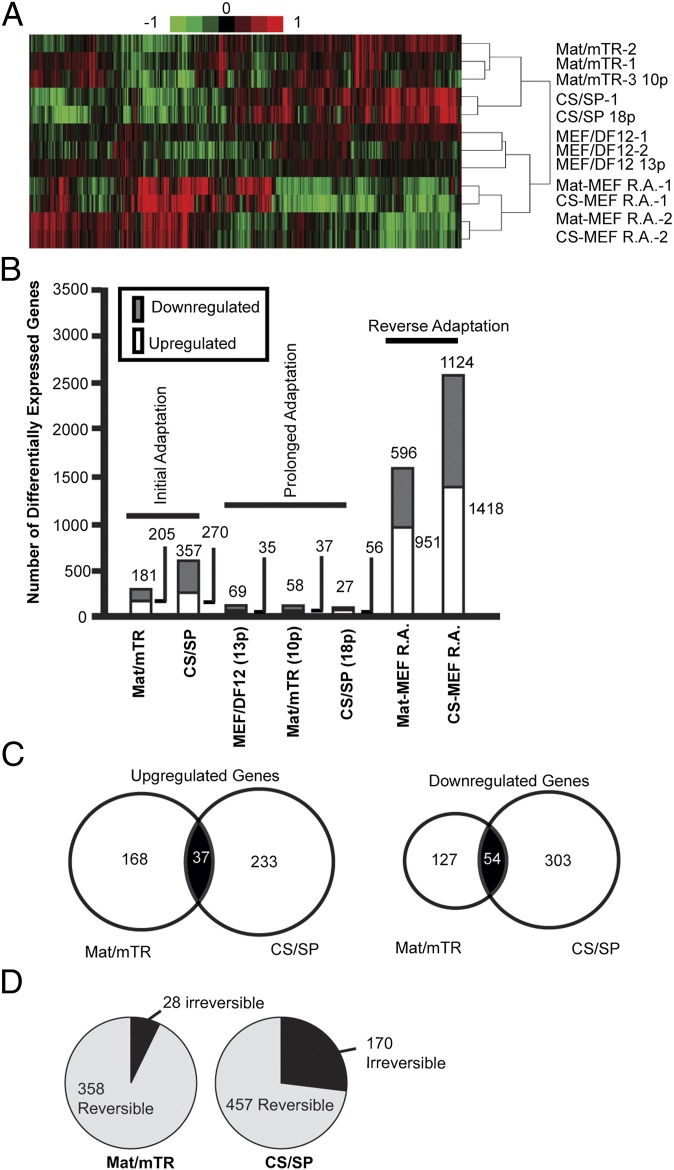
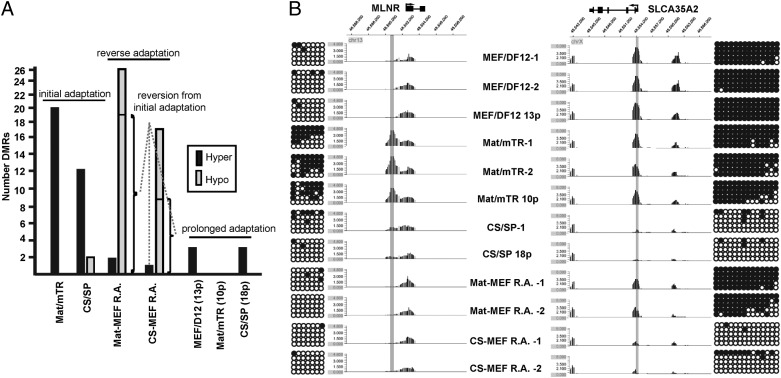
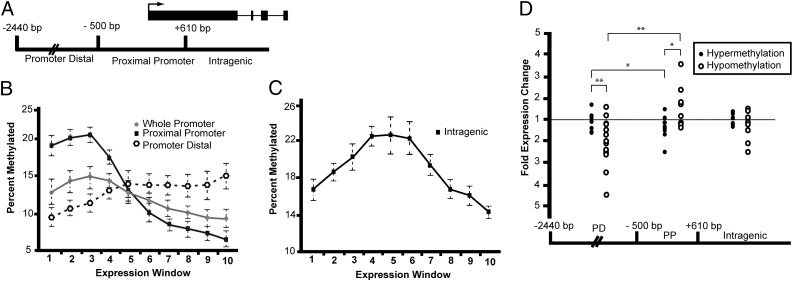
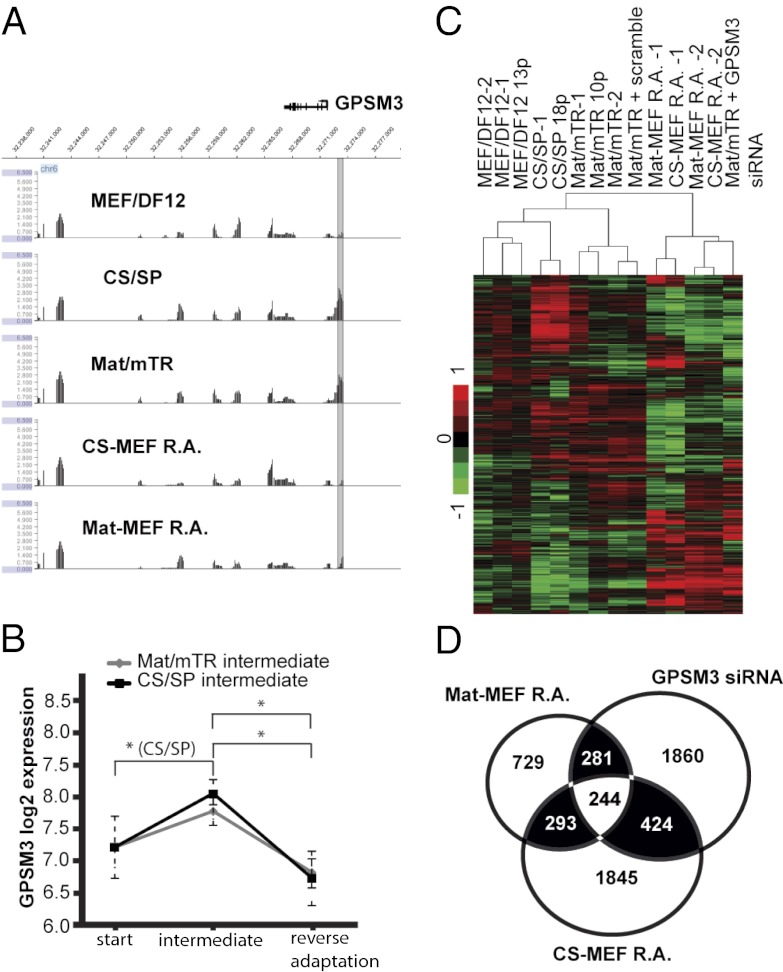
The stability of human embryonic stem cells (hESCs) is of critical importance for both experimental and clinical applications. We find that as an initial response to altered culture conditions, hESCs change their transcription profile for hundreds of genes and their DNA methylation profiles for several genes outside the core pluripotency network. After adaption to conditions of feeder-free defined and/or xeno-free culture systems, expression and DNA methylation profiles are quite stable for additional passaging. However, upon reversion to the original feeder-based culture conditions, numerous transcription changes are not reversible. Similarly, although the majority of DNA methylation changes are reversible, highlighting the plasticity of DNA methylation, a few are persistent. Collectively, this indicates these cells harbor a memory of culture history. For culture-induced DNA methylation changes, we also note an intriguing correlation: hypomethylation of regions 500-2440 bp upstream of promoters correlates with decreased expression, opposite to that commonly seen at promoter-proximal regions. Lastly, changes in regulation of G-coupled protein receptor pathways provide a partial explanation for many of the unique transcriptional changes observed during hESC adaptation and reverse adaptation.


Conflict of interest statement

The authors declare no conflict of interest.

Figures

Fig. 1.
Fig. 1.
Overview of hESC culture adaptation strategy and validation of pluripotency marks. (A) Overview of culture strategy/sample collection. HES-2 hESCs grown on MEFs were adapted to Mat/mTR- or CS/SP-culture conditions and then reverse adapted to MEF/DF12. Additional samples were collected after more passaging and from separate hESC recoveries. (B) Heat map illustrating relative gene expression of pluripotent and lineage-specific markers by microarray analysis. Highly expressed genes are in red; minimally expressed genes are shaded green. Plur = pluripotency; Mes = mesoderm; End = endoderm; Ect = ectoderm; and Troph = trophoblast. Scale is log2 expression value.
Fig. 2.
Fig. 2.
Gene expression changes during hESC culture adaptation. (A) Hierarchical clustering of expression data. Low intensity genes were removed if failing to meet the criteria of log2 intensity value of 8 in at least 10% of samples. Filtered genes were subjected to clustering with Pearson’s correlation and complete linkage using Cluster v3.0. (B) Numbers of differentially expressed genes during hESC culture adaptation (>twofold change, P < 0.01, moderated t test). Initial adaptation: Mat/mTR- or CS/SP-adapted culture vs. start MEF/DF12 culture; prolonged adaptation: final passage vs. initial adaptation or original start culture for MEF/DF12 samples; reverse adaptation: reverse-adapted cells vs. Mat/mTR or CS/SP intermediate culture conditions. (C) Venn diagrams showing overlap of differentially expressed genes between Mat/mTR- and CS/SP-adapted cultures. (D) Reversibility of expression changes. Differential gene expression identified during Mat/mTR or CS/SP acclimation was considered irreversible if still significantly up- or down-regulated in final MEF/DF12 reverse-adapted samples compared with Mat/mTR or CS/SP intermediates cultures.
Fig. 3.
Fig. 3.
DNA methylation in hESCs during culture adaptation. (A) Summary of DMRs across samples. Mat/mTR and CS/SP initial DMRs were identified through comparison with original MEF/DF12-cultured cells. Prolonged DMRs were identified in higher passages versus initial adaptation to Mat/mTR or CS/SP, or in the case of MEF/DF12, p82 versus start culture (p69). Sample descriptions provide passage number postadaptation. Reversible DMRs are noted. Hyper = hypermethylation; Hypo = hypomethylation. (B) Examples of and validation of culture-specific DMRs. A hypermethylated Mat/mTR-specific DMR is shown on the left at the MLNR gene promoter. The peak was identified in three separate Mat/mTR samples and is reversible in accordance with culture conditions. A hypomethylated CS/SP DMR at the SLCA35A2 promoter region is provided on the right. The DMR is an example of a rare irreversible methylation change. MIRA-chip results were validated by bisulfite sequencing of sequences centric to identified DMRs (highlighted in gray). Circles represent consecutive CpG dinucleotides. Dark circles: methylated CpG sites. Open circles: unmethylated CpG sites.
Fig. 4.
Fig. 4.
Correlations of DNA methylation with gene expression. (A) Schematic map illustrating defined boundaries for classifying DNA methylation as related to a generic gene structure. Intergenic DMRs fall in CpG islands annotated anywhere outside of gene-associated regions as defined within the schematic. Arrow indicates TSS. (B) The percent genes with methylated promoter-proximal, promoter-distal, and whole promoters is shown for each of 10 expression windows; 1 = no expression, 10 = highly expressed. Data points are mean ± SD (error bars) of all samples for each expression window. (C) The percent of total genes with intragenic DNA methylation is shown for each of 10 expression windows. (D) Collective expression analysis of genes with associated DMRs. Any gene-associated DMRs identified across samples were pooled into a single graph examining DMR associations with gene-expression changes based on DMR location and the type of methylation change. Fold gene-expression change is displayed for each corresponding DNA methylation change. *P value < 0.05; **P value < 0.005 (Student's t test).
Fig. 5.
Fig. 5.
Knockdown of GPSM3 results in similar transcriptional deregulation seen in reverse-adapted cells. (A) GPSM3 is reversibly promoter-distal hypermethylated during adaptation from MEF/DF12. P value data are displayed at and surrounding each gene for initial and reverse-adapted samples. (B) GPSM3 expression through culture adaptation. Average expression values ± SD for all MEF/DF12, Mat/mTR, CS/SP, and reverse-adapted cells are displayed. (C) Hierarchical clustering of expression results. See Fig. 2 for description of clustering approach. GPSM3 knockdown samples cluster alongside reverse-adapted cells. (D) Many differentially expressed genes stemming from GPSM3 knockdown are differentially expressed in reverse-adapted cells. Venn diagram illustrates overlap of gene expression changes across three conditions.

References

    1. Bird A. DNA methylation patterns and epigenetic memory. Genes Dev. 2002;16:6–21. - PubMed
    1. Riggs AD. DNA methylation and cell memory. Cell Biophys. 1989;15:1–13. - PubMed
    1. Riggs AD, Xiong Z. Methylation and epigenetic fidelity. Proc Natl Acad Sci USA. 2004;101:4–5. - PMC - PubMed
    1. Gong Z, Zhu JK. Active DNA demethylation by oxidation and repair. Cell Res. 2011;21:1649–1651. - PMC - PubMed
    1. Akopian V, et al. International Stem Cell Initiative Consortium Comparison of defined culture systems for feeder cell free propagation of human embryonic stem cells. In Vitro Cell Dev Biol Anim. 2010;46:247–258. - PMC - PubMed

MeSH terms

LinkOut - more resources