

Historical genomics of North American maize
- PMID: 22802642
- PMCID: PMC3412004
- DOI: 10.1073/pnas.1209275109
Historical genomics of North American maize
Abstract
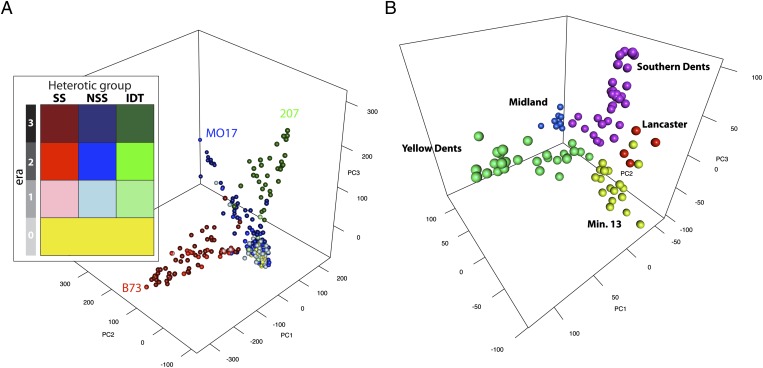
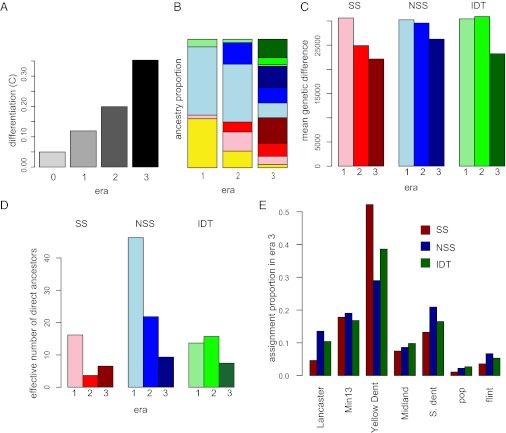
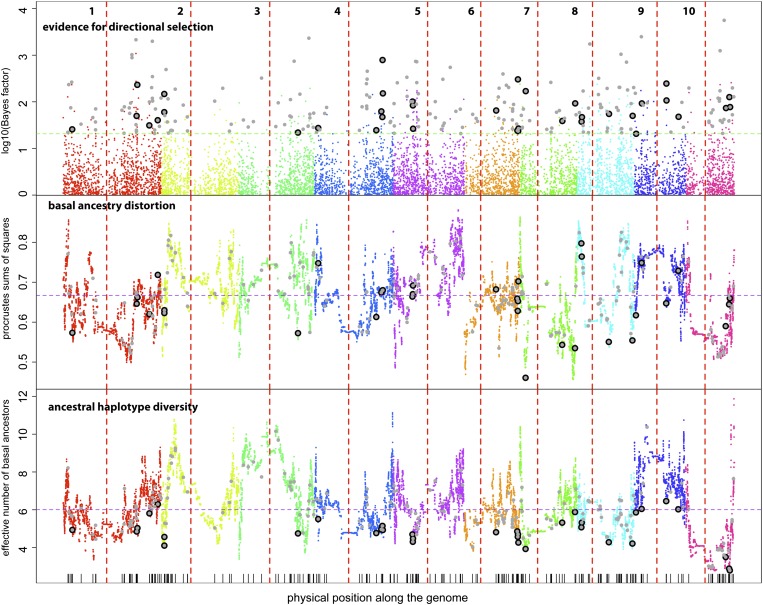
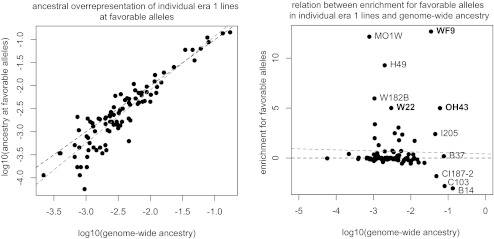
Since the advent of modern plant breeding in the 1930s, North American maize has undergone a dramatic adaptation to high-input agriculture. Despite the importance of genetic contributions to historical yield increases, little is known about the underlying genomic changes. Here we use high-density SNP genotyping to characterize a set of North American maize lines spanning the history of modern breeding. We provide a unique analysis of genome-wide developments in genetic diversity, ancestry, and selection. The genomic history of maize is marked by a steady increase in genetic differentiation and linkage disequilibrium, whereas allele frequencies in the total population have remained relatively constant. These changes are associated with increasing genetic separation of breeding pools and decreased diversity in the ancestry of individual lines. We confirm that modern heterotic groups are the product of ongoing divergence from a relatively homogeneous landrace population, but show that differential landrace ancestry remains evident. Using a recent association approach, we characterize signals of directional selection throughout the genome, identifying a number of candidate genes of potential agronomic relevance. However, overall we find that selection has had limited impact on genome-wide patterns of diversity and ancestry, with little evidence for individual lines contributing disproportionately to the accumulation of favorable alleles in today's elite germplasm. Our data suggest breeding progress has mainly involved selection and recombination of relatively common alleles, contributed by a representative but limited set of ancestral lines.
Conflict of interest statement
The authors declare no conflict of interest.
Figures
Similar articles
-
Molecular characterization of global maize breeding germplasm based on genome-wide single nucleotide polymorphisms.Theor Appl Genet. 2009 Dec;120(1):93-115. doi: 10.1007/s00122-009-1162-7. Epub 2009 Oct 11. Theor Appl Genet. 2009. PMID: 19823800
-
Genome-wide selection and genetic improvement during modern maize breeding.Nat Genet. 2020 Jun;52(6):565-571. doi: 10.1038/s41588-020-0616-3. Epub 2020 Apr 27. Nat Genet. 2020. PMID: 32341525
-
Unraveling the genetic architecture of subtropical maize (Zea mays L.) lines to assess their utility in breeding programs.BMC Genomics. 2013 Dec 13;14:877. doi: 10.1186/1471-2164-14-877. BMC Genomics. 2013. PMID: 24330649 Free PMC article.
-
Genomic screening for artificial selection during domestication and improvement in maize.Ann Bot. 2007 Nov;100(5):967-73. doi: 10.1093/aob/mcm173. Epub 2007 Aug 18. Ann Bot. 2007. PMID: 17704539 Free PMC article. Review.
-
Diversity in global maize germplasm: characterization and utilization.J Biosci. 2012 Nov;37(5):843-55. doi: 10.1007/s12038-012-9227-1. J Biosci. 2012. PMID: 23107920 Review.
Cited by
-
De novo genome assembly and analyses of 12 founder inbred lines provide insights into maize heterosis.Nat Genet. 2023 Feb;55(2):312-323. doi: 10.1038/s41588-022-01283-w. Epub 2023 Jan 16. Nat Genet. 2023. PMID: 36646891
-
Ups and downs of a transcriptional landscape shape iron deficiency associated chlorosis of the maize inbreds B73 and Mo17.BMC Plant Biol. 2013 Dec 13;13:213. doi: 10.1186/1471-2229-13-213. BMC Plant Biol. 2013. PMID: 24330725 Free PMC article.
-
DeepCob: precise and high-throughput analysis of maize cob geometry using deep learning with an application in genebank phenomics.Plant Methods. 2021 Aug 21;17(1):91. doi: 10.1186/s13007-021-00787-6. Plant Methods. 2021. PMID: 34419093 Free PMC article.
-
Genome-wide comparative diversity uncovers multiple targets of selection for improvement in hexaploid wheat landraces and cultivars.Proc Natl Acad Sci U S A. 2013 May 14;110(20):8057-62. doi: 10.1073/pnas.1217133110. Epub 2013 Apr 29. Proc Natl Acad Sci U S A. 2013. PMID: 23630259 Free PMC article.
-
A genomic analysis of the University of Nebraska Replicated Recurrent Selection program.Theor Appl Genet. 2023 Nov 11;136(12):243. doi: 10.1007/s00122-023-04475-y. Theor Appl Genet. 2023. PMID: 37950832
References
-
- Duvick DN. The contribution of breeding to yield advances in maize (Zea mays L.) Adv Agron. 2005;86:83–145.
-
- Troyer AF. Background of US hybrid corn. Crop Sci. 1999;39:601–626.
-
- Mikel MA, Dudley JW. Evolution of North American dent corn from public to proprietary germplasm. Crop Sci. 2006;46:1193–1205.
-
- Tracy WF, Chandler MA. The historical and biological basis of the concept of heterotic patterns in corn belt dent maize. In: Lamkey KR, Lee M, editors. Plant Breeding: The Arnel R Hallauer International Symposium. Ames, IA: Blackwell Publishing; 2006. pp. 219–233.
-
- Troyer AF. In: Handbook of Maize Genetics and Genomics: Volume II: Genetics and Genomics. Bennetzen JL, Hake S, editors. New York: Springer Science + Business Media LLC; 2009.
Publication types
MeSH terms
LinkOut - more resources
Full Text Sources
Other Literature Sources
