. 2012 Oct 16;109 Suppl 2(Suppl 2):17174-9.
doi: 10.1073/pnas.1121252109. Epub 2012 Jul 16.

Social structures depend on innate determinants and chemosensory processing in Drosophila

Affiliations

Social structures depend on innate determinants and chemosensory processing in Drosophila

Jonathan Schneider et al. Proc Natl Acad Sci U S A. .

Abstract

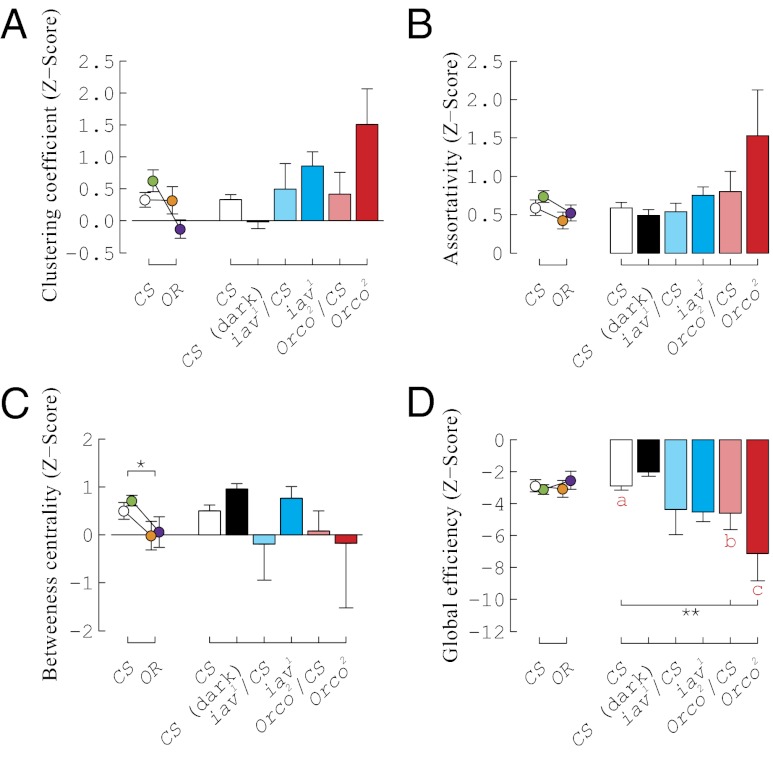
Flies display transient social interactions in groups. However, whether fly-fly interactions are stochastic or structured remains unknown. We hypothesized that groups of flies exhibit patterns of social dynamics that would manifest as nonrandom social interaction networks. To test this, we applied a machine vision system to track the position and orientation of flies in an arena and designed a classifier to detect interactions between pairs of flies. We show that the vinegar fly, Drosophila melanogaster, forms nonrandom social interaction networks, distinct from virtual network controls (constructed from the intersections of individual locomotor trajectories). In addition, the formation of interaction networks depends on chemosensory cues. Gustatory mutants form networks that cannot be distinguished from their virtual network controls. Olfactory mutants form networks that are greatly disrupted compared with control flies. Different wild-type strains form social interaction networks with quantitatively different properties, suggesting that the genes that influence this network phenotype vary across and within wild-type populations. We have established a paradigm for studying social behaviors at a group level in Drosophila and expect that a genetic dissection of this phenomenon will identify conserved molecular mechanisms of social organization in other species.


Conflict of interest statement

The authors declare no conflict of interest.

Figures

Fig. 1.
Fig. 1.
Wild-type strains of Drosophila form SINs via fly–fly interactions. (A) Criteria for interaction between two flies are (i) the angle (α) subtended by the long axis of fly 1 (the interactor) and the line segment connecting fly 1’s center of area to that of fly 2 (the interactee) is less than or equal to 90°, (ii) the length of that line segment is less than or equal to two body lengths of the initiator fly (x), and (iii) these two conditions are maintained for at least 1.5 s. This classification scheme encodes the polarity of the interaction and defines an edge in the network. (B) Example network formed by flies (Movie S5). Each interaction that fulfills the criteria of A is represented by an arrow between individuals. The number of interactions (incoming and outgoing) that a fly has participated in (a fly’s degree) is indicated (the variance of the degrees in a network is used in G). (C–F) Effects of strain and sex on behavioral parameters during network formation between Canton-S males and females and Oregon-R males and females. (C) Mean locomotor rate (total distance traveled divided by trial length) was unaffected by sex or strain. (D) Canton-S and Oregon-R females formed interactions at a significantly higher rate than males (P < 0.001), and Canton-S flies made interactions more frequently than Oregon-R flies (P < 0.001). (E) Interaction duration exhibited a strain × sex effect, with Canton-S females interacting for longer durations than Canton-S males, whereas Oregon-R males and females displayed similar interaction durations (P < 0.001). (F) Proportion of interactions that were reciprocated by the receiver exhibited no strain, sex, or interaction effect. (G) Degree distribution variance of the networks formed by each strain/sex group was compared with both Erdős–Rényi (E-R) random networks as well as virtual network controls, which control for the encounter rates expected from the basic locomotor behavior of flies within our arena without social feedback (Fig. S2). Recombining Canton-S or Oregon-R trajectories for virtual networks always resulted in the formation of at least one network (at least 1,000 recombinations were done for each strain/sex). All wild-type groups displayed a significantly higher degree distribution variance than E-R networks (shaded line) and a significantly lower degree distribution variance from virtual network controls (hatched lines). (H) Each individual's degree in the first network iteration plotted against that same individual's degree in the last network iteration of the trial. The means of the last degree were connected and plotted along the first degree axis and show no correlation and no strain or sex difference. (I) The probability of being the receiver in an interaction increases with an individual's total degree. The mean probability of receiving an interaction is plotted, and this function of preferential attachment shows no sex or strain difference. (A–I) Colors indicate strain and sex: Canton-S males (n = 43, white) and females (n = 26, green) and Oregon-R males (n = 28, orange) and females (n = 23, purple). *P < 0.05, **P < 0.01, and ***P < 0.001, only when significance is maintained after multiple test corrections. B–F analyzed using two-way ANOVAs (Methods). Error bars indicate mean ± 1 SE. Boxplot whiskers indicate 1.5*(interquartile range). Measurements presented here represent networks at 25% density (33 unique directed interactions). Tables S2 and S3 show all relevant P values.
Fig. 2.
Fig. 2.
Effects of sensory manipulations on male behavioral characteristics during network formation. (A) Movement during trials was unaffected by visual cues (Canton-S vs. Canton-S in the dark), acoustic cues (Canton-S vs. iav1/Canton-S vs. iav1/iav1; P = 0.0615), or gustatory cues (poxnSuper-A vs. poxnΔXBs6) but was affected by olfactory cues (Canton-S vs. Orco2/Canton-S vs. Orco2/Orco2; P = 0.23, not significant after multiple test correction). (B) Rate of interactions was significantly reduced by eliminating visual cues (P < 0.001) and was significantly reduced in heterozygotes for the iav1 mutation (P < 0.001). Olfactory cues significantly affect the rate of interaction, Orco2/Canton-S and Orco2/Orco2 exhibiting a slower rate than Canton-S (P ≤ 0.001). (C) Average duration of an interaction was affected only by visual cues, because Canton-S in the dark has significantly shorter interactions (P < 0.001). (D) Percentage of interactions reciprocated by the receiving fly was increased by affecting acoustic cues (P = 0.011) and olfactory cues (P < 0.001). (E) As in Fig. 1, variances of degree distribution were compared with Erdős–Rényi (E-R) random networks (shaded line) and virtual network controls (hatched lines) with a sign test. There was some variation in the success of generating these virtual networks (100% for Canton-S, Canton-S in the dark, iav1/Canton-S, and iav1/iav1, 99.9% for Orco2/Canton-S, 82% for Orco2, 99% for poxnSuper-A, and 71% for poxnΔXBs6 ; at least 500 virtual networks were established for each genotype). All genotypes had a significantly higher variance of degree distribution than E-R random networks. All groups besides poxnΔXBs6 had significantly lower variance of the observed degree distribution compared with their respective virtual networks. As poxnΔXBs6 was not significantly different from its virtual network controls (P = 0.061), this strain was excluded in further analysis. A–D analyzed with ANOVAs (Methods). Groups are color-coded: Canton-S (n = 43, white), Canton-S in the dark (n = 28, black), iav1/Canton-S (n = 26, light blue), iav1/iav1 (n = 26, blue), Orco2/Canton-S (n = 24, light red), Orco2/Orco2 (n = 14, red), poxnSuper-A (n = 21, light brown), and poxnΔXBs6 (n = 12, brown). *P < 0.05, **P < 0.01, ***P < 0.001, only when significance is maintained after multiple test corrections. Statistical group identities (lowercase letters) are color-coded by test. All significant effects of Orco2 were observed in both a Canton-S as well as a w1118 background (Fig. S8). Error bars indicate mean ± 1 SE. Boxplot whiskers indicate 1.5*(interquartile range). Measurements presented here represent networks at 25% density (33 unique directed interactions). Tables S2 and S3 show all relevant P values.
Fig. 3.
Fig. 3.
Strain and sensory mutation affect network organization. Measurements for each network were standardized to 10,000 random network simulations which preserved distribution of the in- and out-degrees of the iterative network, creating a z score. (A) Clustering of flies within the networks was not different between Oregon-R and Canton-S: neither strain (P = 0.019) nor sex × strain interaction (P = 0.023) were significant after multiple test correction. Canton-S in light vs. Canton-S in dark was also not different (P = 0.036) after multiple test correction. Mutations affecting acoustic and olfactory modalities did not affect the clustering coefficient (acoustic: Canton-S vs. iav1/Canton-S vs. iav1/iav1; P = 0.292, olfactory: Canton-S vs. Orco2/Canton-S vs. Orco2/Orco2, P = 0.019; not significant after multiple test correction). (B) Assortativity of the networks was not higher in Canton-S compared with Oregon-R (P = 0.0738) or in olfactory mutants compared with controls (P = 0.048; not significant after multiple test correction). (C) Betweeness centrality is significantly higher in Canton-S compared with Oregon-R (P = 0.012). Eliminating visual cues did not increase the betweeness centrality of Canton-S (P = 0.033; not significant after multiple-test correction). (D) Global efficiency did not increase by eliminating visual cues (P = 0.099) but significantly decreased in olfactory mutants (P = 0.005). A–D analyzed with ANOVAs (Methods). Groups are color-coded: Canton-S males (n = 43, white) and females (n = 26, green), Oregon-R males (n = 28, orange) and females (n = 23, purple), Canton-S in the dark (n = 28, black), iav1/Canton-S (n = 26, light blue), iav1/iav1 (n = 26, blue), Orco2/Canton-S (n = 24, light red), Orco2/Orco2 (n = 14, red), poxnSuper-A (n = 21, light brown), and poxnΔXBs6 (n = 12, brown). *P < 0.05, **P < 0.01, ***P < 0.001, if significance is maintained after multiple test corrections. Group identities (lowercase letters) are color-coded by test. All significant effects of Orco2 were observed in both a Canton-S as well as a w1118 background (Fig. S8). Error bars indicate mean ± 1 SE. Measurements presented here represent networks at 25% density (33 unique directed interactions).
Fig. 4.
Fig. 4.
Network dynamics seem to be consistent at varying densities. Networks were evaluated at 12.5%, 20%, 25%, 50%, and 75% density to determine consistency of network dynamics (17, 27, 33, 66, and 99 unique directed interactions, respectively; see text). Z scores were based on 500 simulations, which preserved the in- and out-degree of the iterative networks. The difference between strains in betweeness centrality (A) displayed a strong trend from 20% to 50% (Canton-S males, n = 43, 43, 42, and 40; Canton-S females n = 26, 26, 26, 26, and 26; Oregon-R males n = 28, 28, 28, 25, and 19; Oregon-R females n = 23, 23, 23, 23, and 20, at 12.5%, 20%, 25%, 50%, and 75% density, respectively). The reduction of global network efficiency in Orco2 mutants (B) showed a consistent trend from 12.5% to 50% (Orco2/Canton-S n = 27, 25, 24, 21, and 11; Orco2 n = 23, 18, 14, 6, and 2 at 12.5%, 20%, 25%, 50%, and 75% density, respectively). (A–D) *P < 0.05, **P < 0.01, ***P < 0.001, if significance is maintained after multiple test corrections. Significant effects of Orco2 were observed in both a Canton-S as well as a w1118 background (Fig. S8). Error bars indicate mean ± 1 SE.

Similar articles

Cited by

References

    1. Sarin S, Dukas R. Social learning about egg-laying substrates in fruitflies. Proc Biol Sci. 2009;276:4323–4328. - PMC - PubMed
    1. Shorrocks B. Drosophila. London: Ginn; 1972.
    1. Sokolowski MB. Social interactions in “simple” model systems. Neuron. 2010;65:780–794. - PubMed
    1. Wertheim B, van Baalen EJ, Dicke M, Vet LE. Pheromone-mediated aggregation in nonsocial arthropods: An evolutionary ecological perspective. Annu Rev Entomol. 2005;50:321–346. - PubMed
    1. Mery F, et al. Public versus personal information for mate copying in an invertebrate. Curr Biol. 2009;19:730–734. - PubMed

Publication types

LinkOut - more resources