

Identification of factors contributing to variability in a blood-based gene expression test
- PMID: 22802952
- PMCID: PMC3388994
- DOI: 10.1371/journal.pone.0040068
Identification of factors contributing to variability in a blood-based gene expression test
Abstract
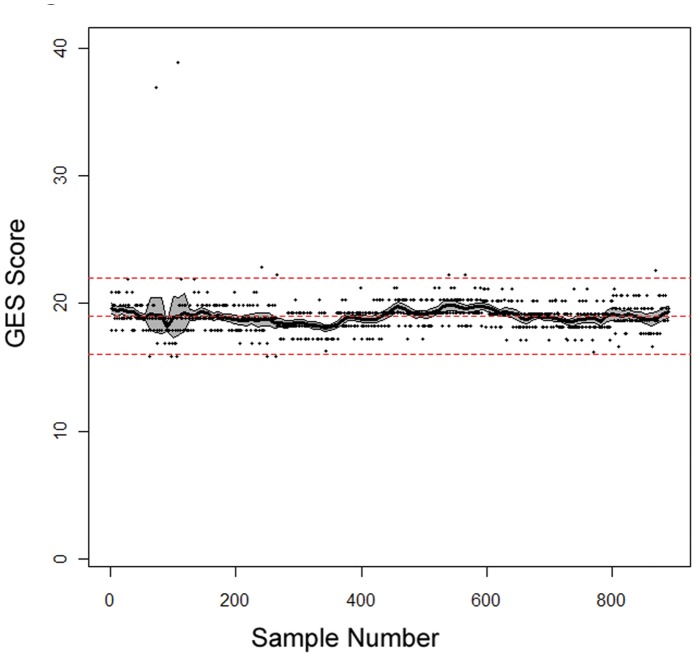
Background: Corus CAD is a clinically validated test based on age, sex, and expression levels of 23 genes in whole blood that provides a score (1-40 points) proportional to the likelihood of obstructive coronary disease. Clinical laboratory process variability was examined using whole blood controls across a 24 month period: Intra-batch variability was assessed using sample replicates; inter-batch variability examined as a function of laboratory personnel, equipment, and reagent lots.
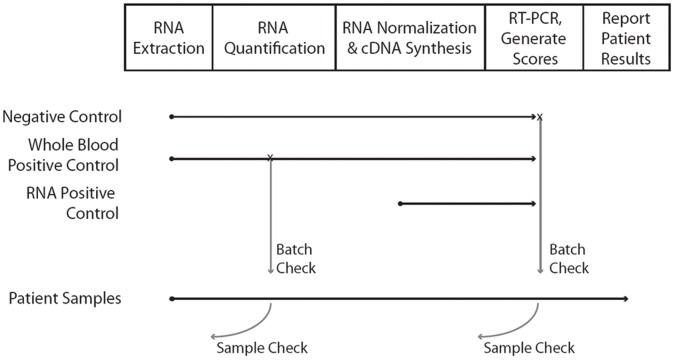
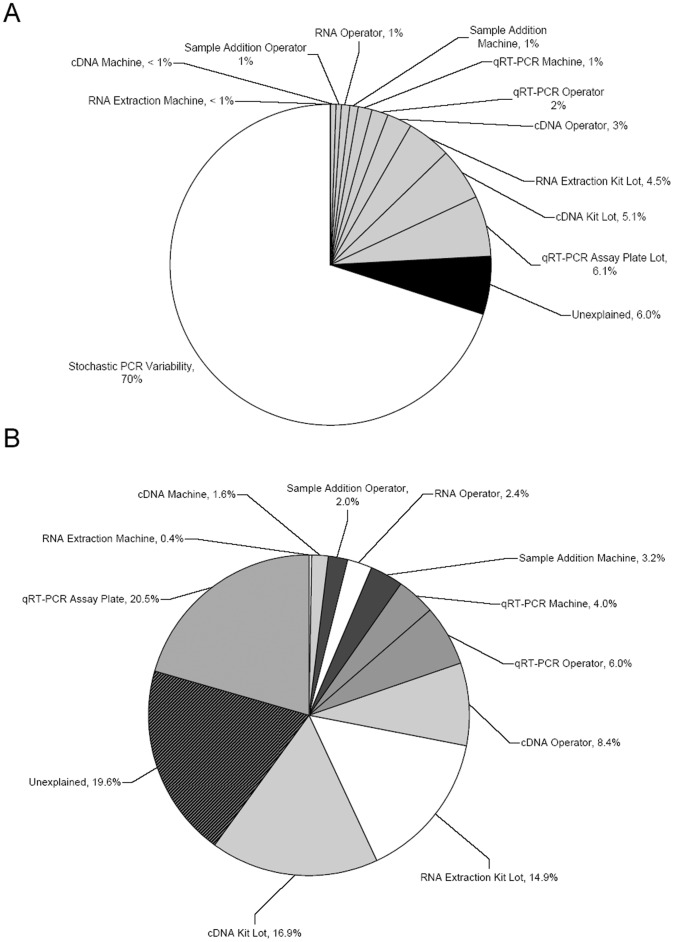
Methods/results: To assess intra-batch variability, five batches of 132 whole blood controls were processed; inter-batch variability was estimated using 895 whole blood control samples. ANOVA was used to examine inter-batch variability at 4 process steps: RNA extraction, cDNA synthesis, cDNA addition to assay plates, and qRT-PCR. Operator, machine, and reagent lots were assessed as variables for all stages if possible, for a total of 11 variables. Intra- and inter-batch variations were estimated to be 0.092 and 0.059 Cp units respectively (SD); total laboratory variation was estimated to be 0.11 Cp units (SD). In a regression model including all 11 laboratory variables, assay plate lot and cDNA kit lot contributed the most to variability (p = 0.045; 0.009 respectively). Overall, reagent lots for RNA extraction, cDNA synthesis, and qRT-PCR contributed the most to inter-batch variance (52.3%), followed by operators and machines (18.9% and 9.2% respectively), leaving 19.6% of the variance unexplained.
Conclusion: Intra-batch variability inherent to the PCR process contributed the most to the overall variability in the study while reagent lot showed the largest contribution to inter-batch variability.
Conflict of interest statement
Figures
References
-
- Lampe JW, Stepaniants SB, Mao M, Radich JP, Dai H, et al. Signatures of environmental exposures using peripheral leukocyte gene expression: tobacco smoke. Cancer Epidemiol Biomarkers Prev. 2004;13:445–453. - PubMed
-
- Llaverias G, Pou J, Ros E, Zambon D, Cofan M, et al. Monocyte gene-expression profile in men with familial combined hyperlipidemia and its modification by atorvastatin treatment. Pharmacogenomics. 2008;9:1035–1054. - PubMed
-
- Nakamura S, Kobayashi M, Sugino T, Kajimoto O, Matoba R, et al. Effect of exercise on gene expression profile in unfractionated peripheral blood leukocytes. Biochem Biophys Res Commun. 2010;391:846–851. - PubMed
MeSH terms
Substances
LinkOut - more resources
Full Text Sources
Medical
Miscellaneous
