

Muscle dimensions of the foot in the orangutan and the chimpanzee
- PMID: 22803586
- PMCID: PMC3458250
- DOI: 10.1111/j.1469-7580.2012.01545.x
Muscle dimensions of the foot in the orangutan and the chimpanzee
Abstract
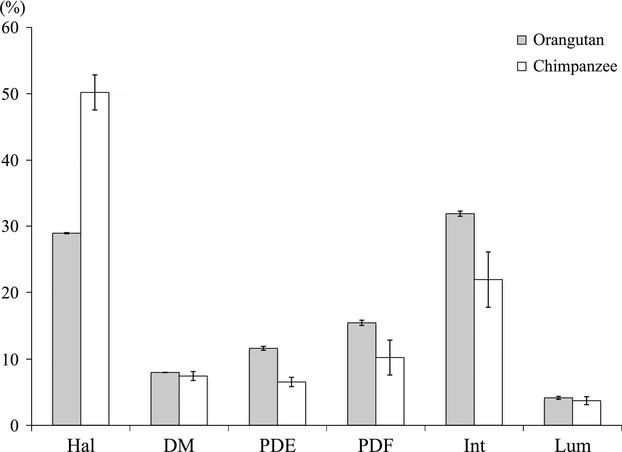
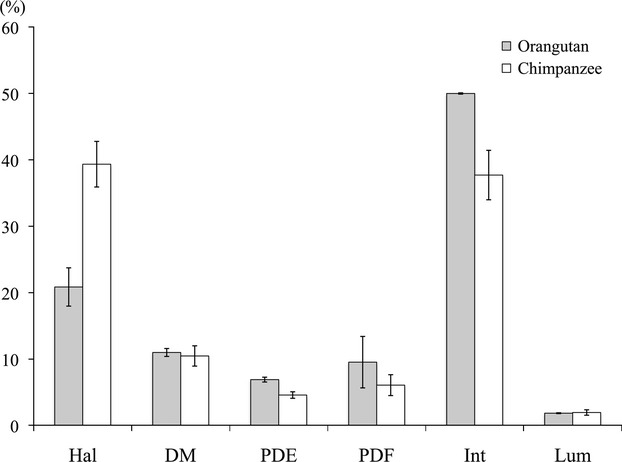
The hindlimbs of two orangutans and four chimpanzees were dissected, and muscle parameters (mass, fascicle length, and physiological cross-sectional area: PCSA) were determined to explore possible interspecies variation in muscle dimensions. Muscle mass and PCSA were divided by the total mass and total PCSA of the entire foot muscles for normalization. The results indicate that the pedal interosseous and the intrinsic pedal digital extensor muscles in the orangutans probably have higher capacity for force production due to their relatively larger PCSAs than in chimpanzees. Moreover, the medial components of the intrinsic muscles exhibited relatively larger mass and PCSA ratios in orangutans. The mass and PCSA ratios of the hallucal muscles were larger in chimpanzees. These differences in foot muscle dimensions of the two species suggest that the orangutan is more specialized for hook-like digital gripping without involvement of the rudimentary hallux, while the chimpanzee is adapted to hallux-assisted power gripping in arboreal locomotion.
© 2012 The Authors Journal of Anatomy © 2012 Anatomical Society.
Figures
References
-
- Aiello L, Dean C. An Introduction to Human Evolutionary Anatomy. San Diego: Academic Press; 1990.
-
- Anapol F, Barry K. Fiber architecture of the extensors of the hindlimb in semiterrestrial and arboreal guenons. Am J Phys Anthropol. 1996;99:429–447. - PubMed
-
- Boyer EL. The musculature of the inferior extremity of the orang-utan Simia satyrus. Am J Anat. 1935;56:193–256.
-
- Burkholder TJ, Fingado B, Baron S, Lieber RL. Relationship between muscle fiber types and sizes and muscle architectural properties in the mouse hindlimb. J Morphol. 1994;221:177–190. - PubMed
-
- Carlson KJ. Muscle dimension of the common chimpanzee (Pan troglodytes): perspectives for investigating chimpanzee behavior. Primates. 2006;47:218–229. - PubMed
Publication types
MeSH terms
LinkOut - more resources
Full Text Sources
Medical
