. 2012 Sep;49(9):1277-89.
doi: 10.1111/j.1469-8986.2012.01410.x. Epub 2012 Jul 16.

Orthographic neighborhood effects as a function of word frequency: an event-related potential study

Affiliations

Orthographic neighborhood effects as a function of word frequency: an event-related potential study

Marta Vergara-Martínez et al. Psychophysiology. 2012 Sep.

Abstract

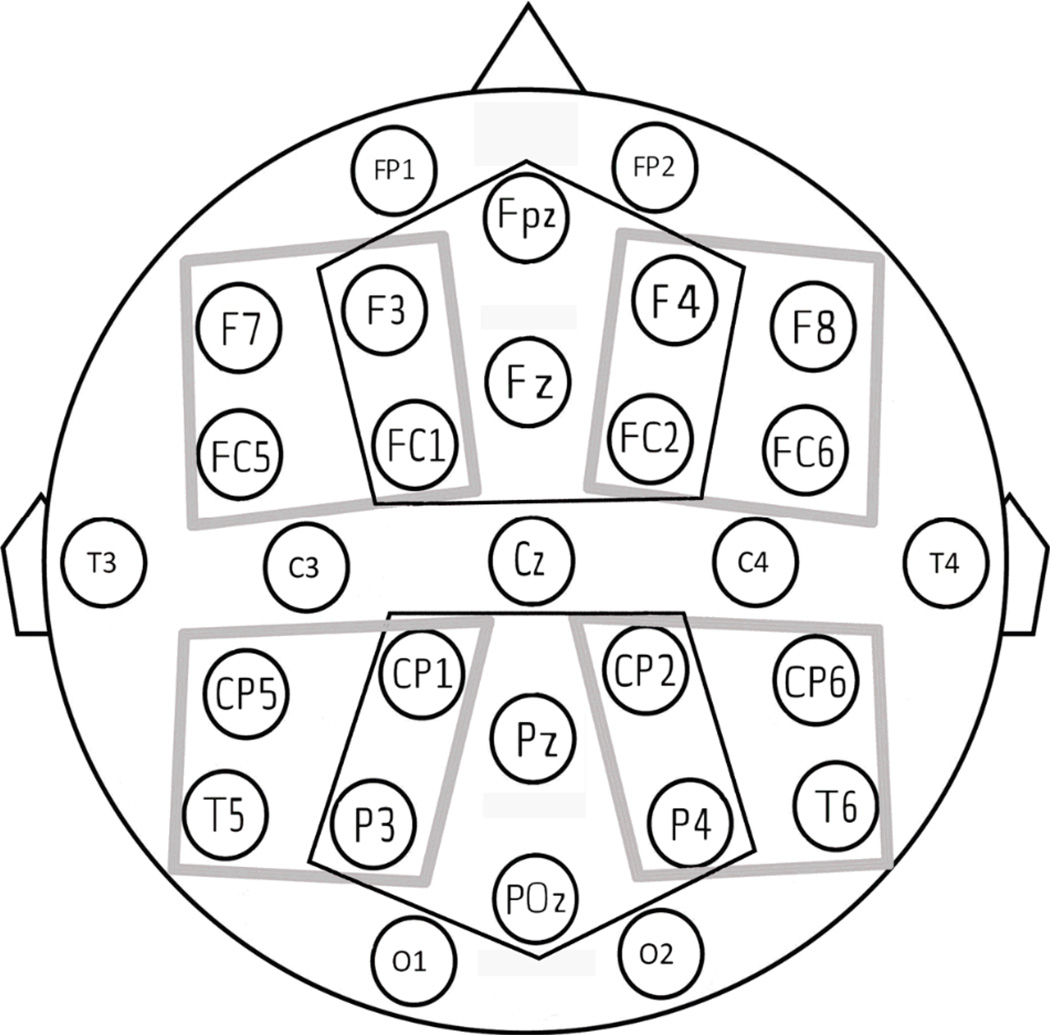
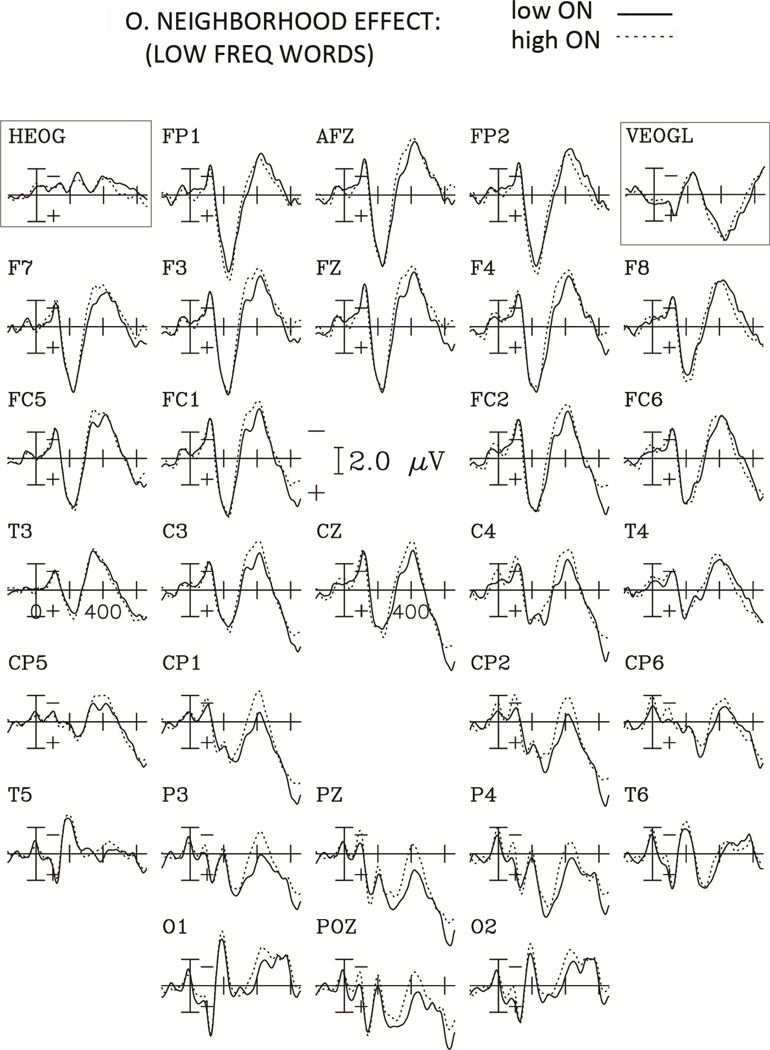
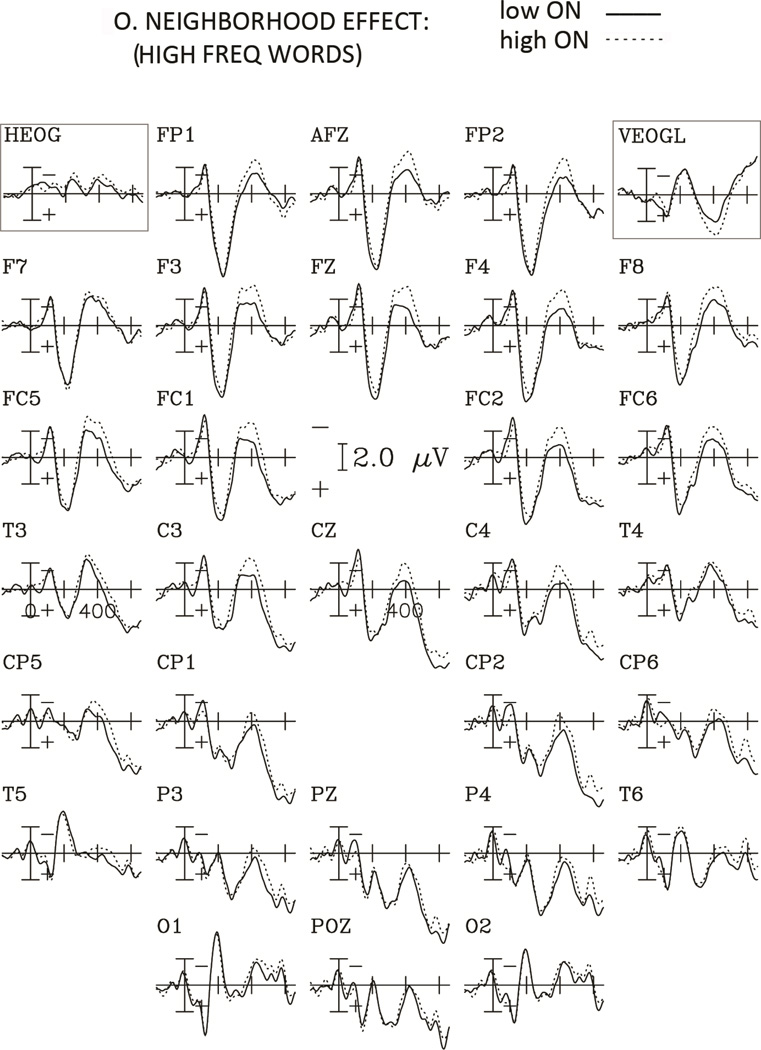
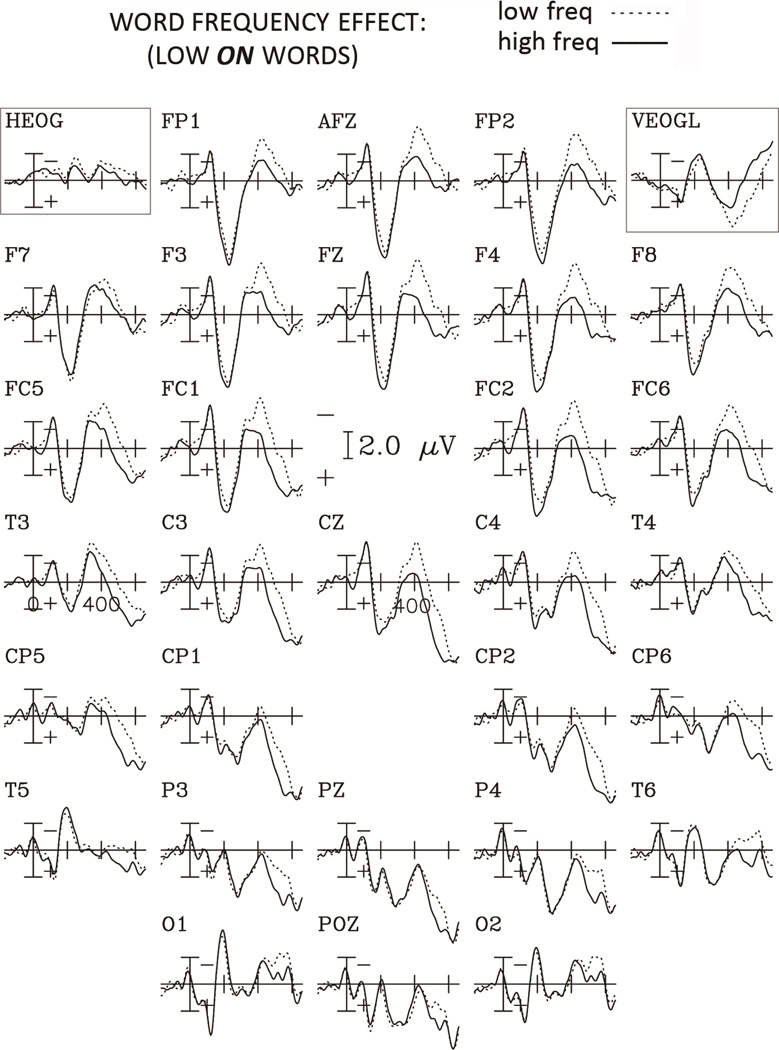
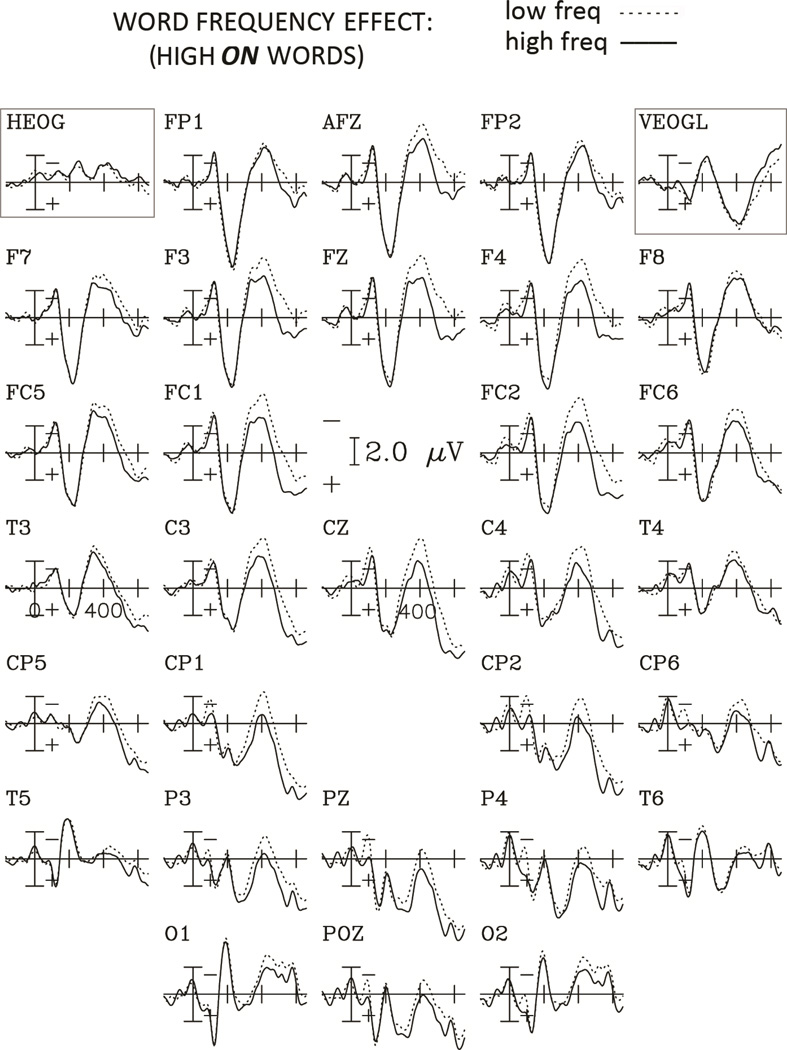
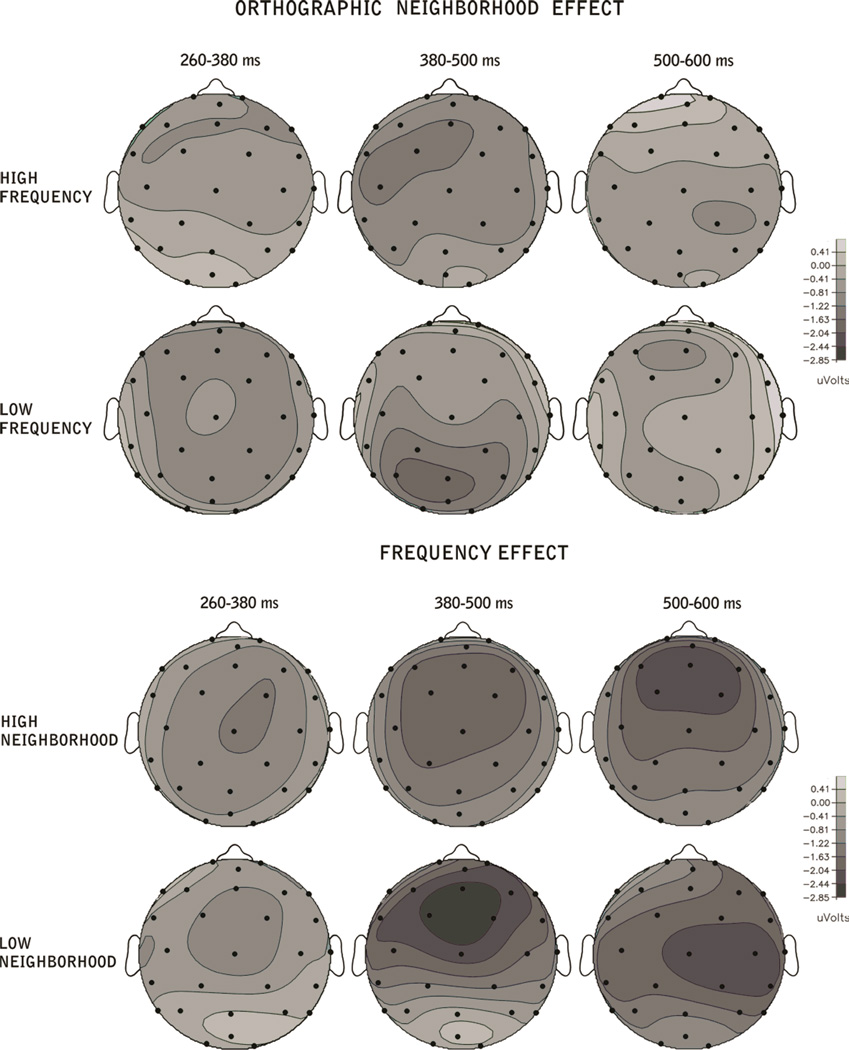
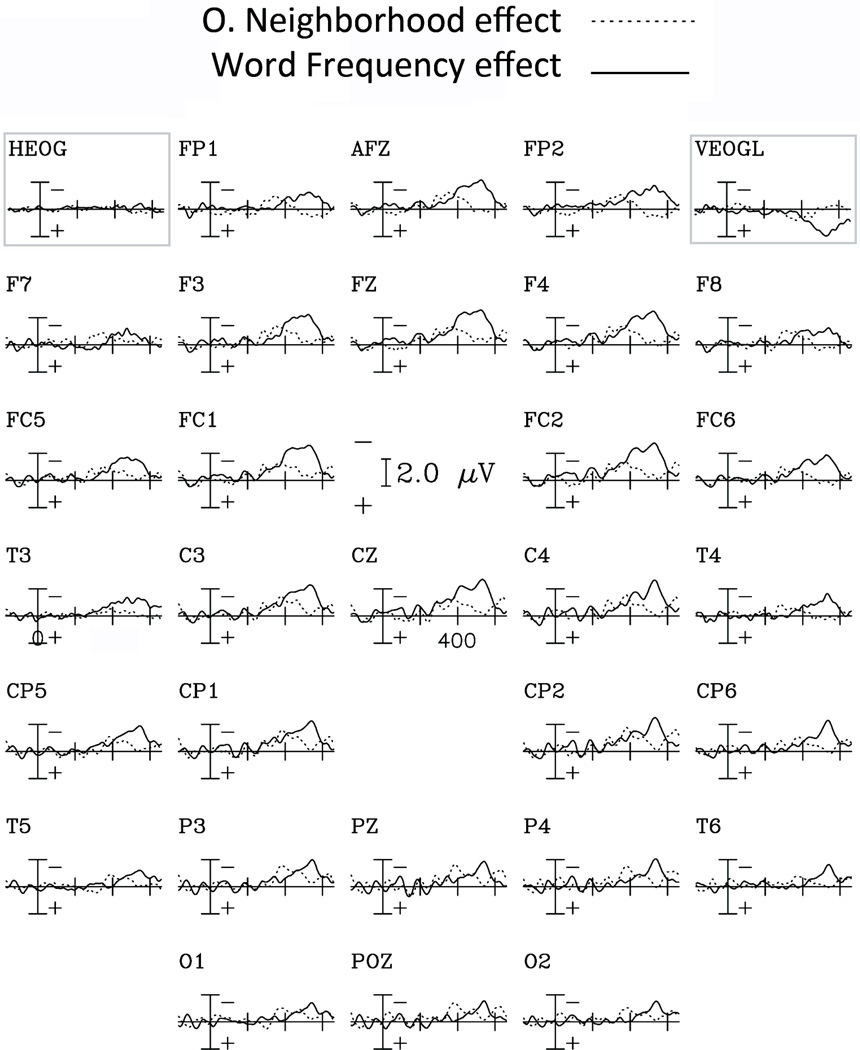
The present study assessed the mechanisms and time course by which orthographic neighborhood size (ON) influences visual word recognition. ERPs were recorded to words that varied in ON and in word frequency while participants performed a semantic categorization task. ON was measured with the Orthographic Levenshtein Distance (OLD20), a richer metric of orthographic similarity than the traditional Coltheart's N metric. The N400 effects of ON (260-500 ms) were larger and showed a different scalp distribution for low than for high frequency words, which is consistent with proposals that suggest lateral inhibitory mechanisms at a lexical level. The ERP ON effects had a shorter duration and different scalp distribution than the effects of word frequency (mainly observed between 380-600 ms) suggesting a transient activation of the subset of orthographically similar words in the lexical network compared to the impact of properties of the single words.


Figures

Figure 1
Figure 1
Schematic flat representation of the 29 electrode positions from which EEG activity was recorded (front of head is at top). The electrodes contributing to the analyses are those grouped in the four critical regions (Ventral analysis: grey lines), and in the two critical regions (Dorsal analysis: black lines).
Figure 2
Figure 2
Grand average ERPs to words with high and low orthographic neighborhood for the Low Frequency condition for the 29 electrodes, and the horizontal and vertical EOG channels. Negative potentials are plotted upwards and each tick mark on the horizontal axis represents 200 ms.
Figure 3
Figure 3
Grand average ERPs to words with high and low orthographic neighborhood for the High Frequency condition for the 29 electrodes, and the horizontal and vertical EOG channels. Negative potentials are plotted upwards and each tick mark on the horizontal axis represents 200 ms.
Figure 4
Figure 4
Grand average ERPs to words with high and low frequency for the Low O. Neighborhood condition for the 29 electrodes, and the horizontal and vertical EOG channels. Negative potentials are plotted upwards and each tick mark on the horizontal axis represents 200 ms.
Figure 5
Figure 5
Grand average ERPs to words with high and low frequency for the High O. Neighborhood condition for the 29 electrodes, and the horizontal and vertical EOG channels. Negative potentials are plotted upwards and each tick mark on the horizontal axis represents 200 ms.
Figure 6
Figure 6
Topographic distribution of the effects of orthographic neighborhood (calculated as the difference in voltage amplitude between the ERP responses to Low vs. High Orthographic Neighborhood conditions, for High and Low Frequency words), and of word frequency (calculated as the difference in voltage amplitude between the ERP responses to High vs. Low Frequency conditions, for High vs. Low Orthographic neighborhood words) for the three time windows.
Figure 7
Figure 7
Difference waveforms comparing the effects of Orthographic Neighborhood and Word Frequency effects for all 29 electrodes’ sites. O. Neighborhood effect is calculated as the difference in voltage amplitude between the ERP responses to Low vs. High Orthographic Neighborhood conditions (collapsed over High and Low frequency words). Word Frequency effect is calculated as the difference in voltage amplitude between the ERP responses to High vs. Low Frequency conditions (collapsed over High and Low Neighborhood words).

Similar articles

Cited by

References

    1. Acha J, Perea M. The effect of neighborhood frequency in reading: Evidence with transposed-letter neighbors. Cognition. 2008;108:290–300. - PubMed
    1. Andrews S. Frequency and neighborhood effects on lexical access: Activation or search? Journal of Experimental Psychology: Learning, Memory and Cognition. 1989;15:802–814.
    1. Andrews S. Frequency and neighborhood effects on lexical access: Lexical similarity or orthographic redundancy? Journal of Experimental Psychology: Learning Memory and Cognition. 1992;18:234–254.
    1. Andrews S. The effect of orthographic similarity on lexical retrieval: Resolving neighborhood conflicts. Psychonomic Bulletin & Review. 1997;4:439–461.
    1. Balota DA, Chumbley JI. Are lexical decisions a good measure of lexical access? The role of word frequency in the neglected decision stage. Journal of Experimental Psychology: Human Perception and Performance. 1984;10:340–357. - PubMed

Publication types

LinkOut - more resources