. 2012 Sep;12(8):929-43.
doi: 10.2174/156652412802480844.

p53 is an important regulator of CCL2 gene expression

Affiliations

p53 is an important regulator of CCL2 gene expression

X Tang et al. Curr Mol Med. 2012 Sep.

Abstract

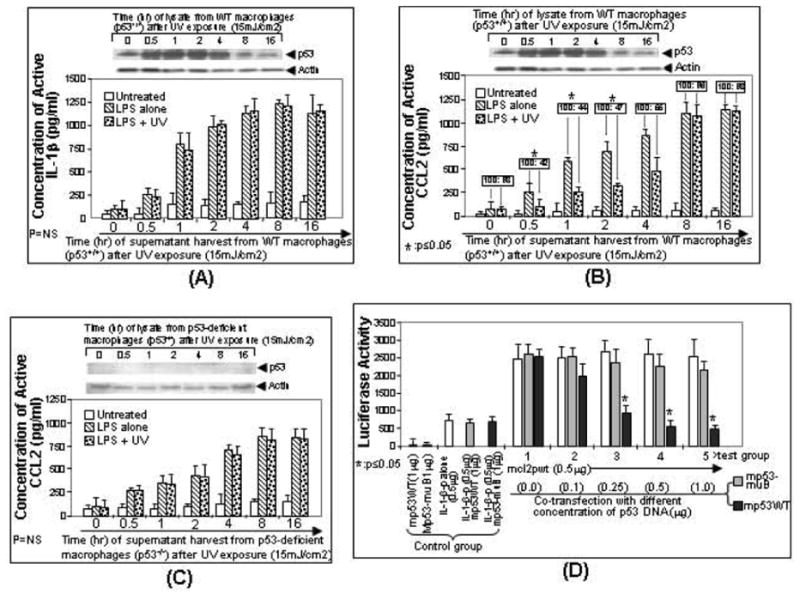
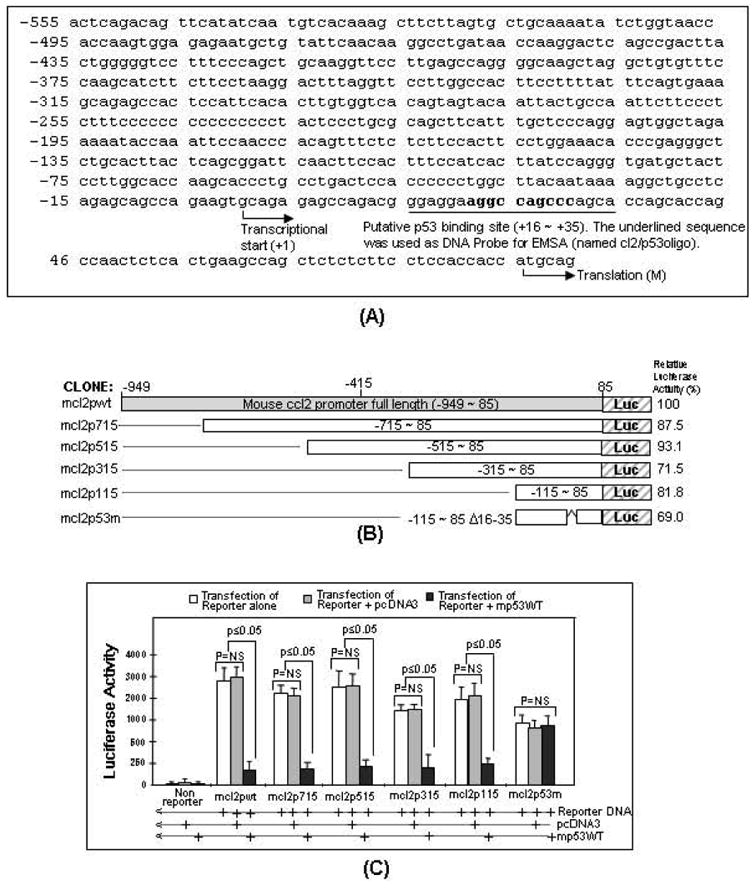
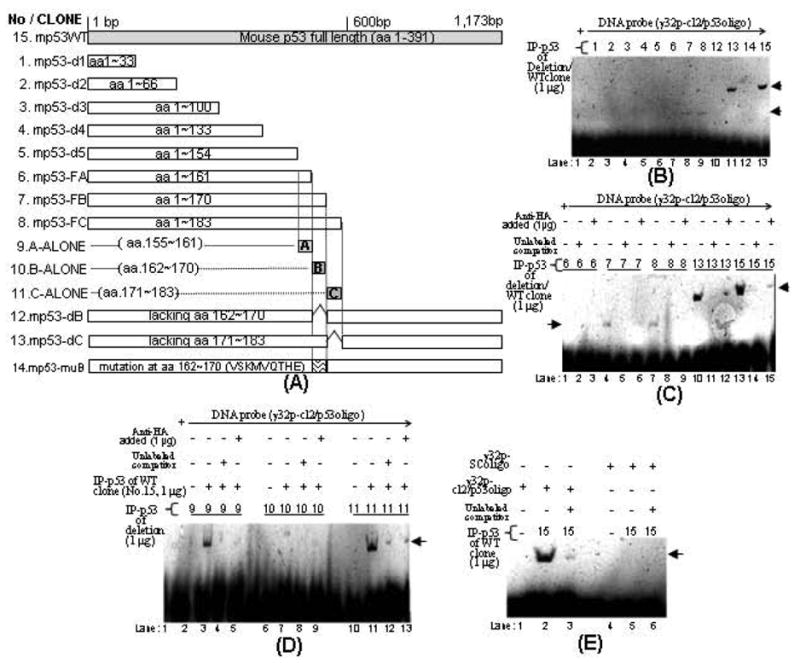
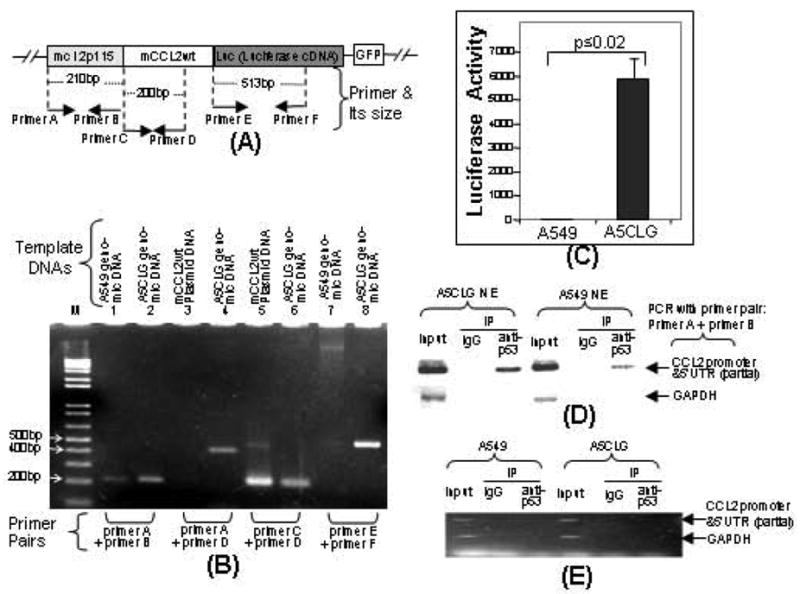
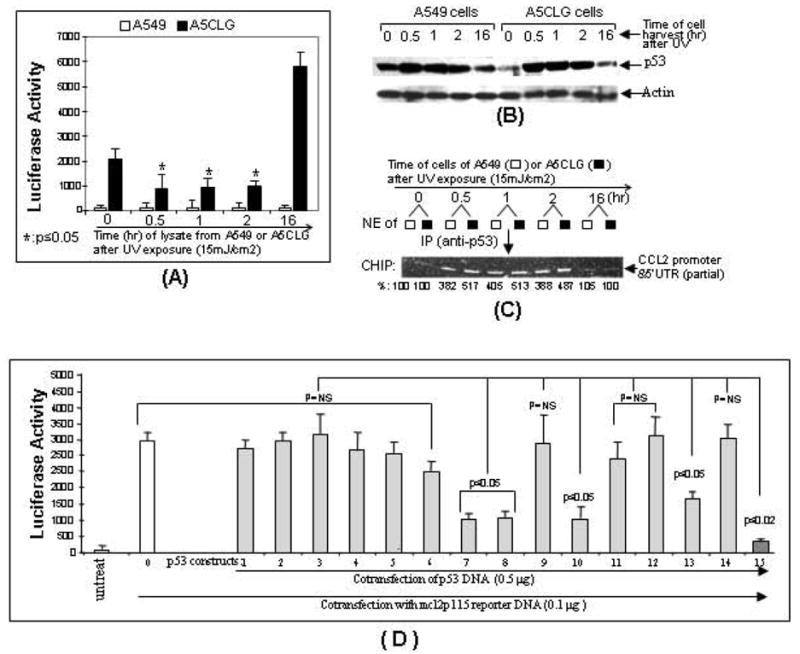
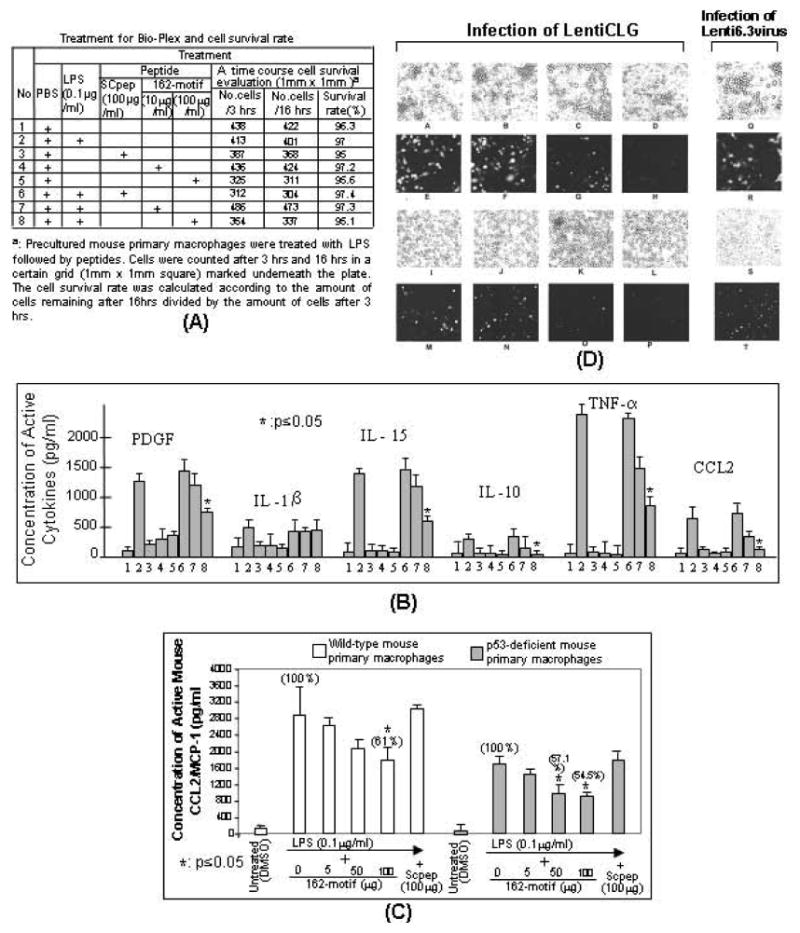
The p53 protein is a sequence-specific DNA-binding factor that regulates inflammatory genes such as CCL2/MCP-1 that may play a role in various diseases. A recent study has indicated that the knockdown of human p53 leads to a strong negative regulation of CCL2 induction. We are therefore interested in how p53 regulates CCL2 gene expression. In the following study, our findings indicate that UV-induced p53 accumulation in mouse macrophages significantly decreases LPS-induced CCL2 production, and that p53 binds to CCL2 5'UTR in the region (16-35). We also found that a p53 domain (p53pep170) mimics full length p53 to down-regulate CCL2 promoter activity. Treatment of p53-deficient mouse primary macrophages with synthetic p53pep170 was found to decrease LPS-induced production of CCL2 without association with cellular endogenous p53. CCL2 production induced by lentiCLG in human monocytes or mouse primary macrophages was blocked in the presence of p53pep170. Overall, these results demonstrate that p53 or its derived peptide (p53pep170) is an important regulator of CCL2 gene expression via its binding activity, and acts as a novel model for future studies linking p53 and its short peptide to pave the way to possible pharmaceutical intervention of CCL2-mediated inflammatory and cancer diseases.


Conflict of interest statement

CONFLICT OF INTEREST

The authors confirm that this article content has no conflicts of interest.

Figures

Fig. (1)
Fig. (1)
Regulation of LPS-induced CCL2 production by the accumulation of endogenous p53. Mouse primary macrophage cells from wild-type mice (A, B) or p53-deficient mice (C) were untreated as control (white bar) or treated with LPS (downward diagonal striped bar) or LPS plus UV radiation (dotted bar). Cells were then cultured. The medium from each group of treated cells were harvested at different times (0, 0.5, 1, 2, 4, 8 or 16 hrs) and assessed for IL-1-β production as control (A) or CCL2 production (B, C) by ELISA (n = 3). The concentration of CCL2 secreted from LPS-treated cells was assigned a value of 100% as the baseline, and the relative CCL2 concentration from co-treated cells by LPS plus UV was calculated (boxed ratio). Values were normalized with respect to protein concentrations. Data are presented as mean ± SEM. In order to detect p53 accumulation, the lysate from cells at each time point was purified and analyzed by Western blot with the antibody against p53 or actin as control (Top panel of A-C). D. Regulation of CCL2 promoter activity by overexpression of p53. U2OS cells were transfected with reporter DNA (mcl2pwt alone or mouse IL-1β promoter alone, white bar, control group) or co-transfected with mcl2pwt DNA and different concentrations (0, 0.1, 0.25, 0.5, or 1μg) of p53 DNA (grey bar for mp53WT or black bar for mp53-muB as control, experimental group 1-5). Cells were cultured overnight. The lysate from cells at each group was assessed by luciferase assay (n = 3). Data are presented as mean ± SEM.
Fig. (2)
Fig. (2)
Analysis of p53 binding site in CCL2 5’UTR&promoter. A. Mouse CCL2 5’UTR&promoter sequence from -949 to +85. BLAST-search of the sequence showed that it was identical to mouse genomic DNA (AL713839) and it ended before the start codon of CCL2. The putative binding sites for p53 in CCL2 5’UTR&promoter were analyzed by PROMO version 3.0.2 (UPC) and bolded. The binding sites for other potential transcription factors have not been analyzed. The oligonucleotide including p53 binding site (Underlined sequence, named cl2/p53oligo) and its complementary oligo were synthesized. Both synthetic oligonucleotides were annealed and labeled with [32P]ATP as a double strand DNA probe for EMSA. B. Diagram of mouse CCL2 5’UTR&promoter DNA constructs and its promoter activity. Different lengths of CCL2 5’UTR&promoter DNA were truncated and inserted into the pGL3-basic vector. Gray box: region representing full length of CCL2 5’UTR&promoter (mcl2pwt). White boxes: region representing CCL2 5’UTR&promoter deletions from 85 to -715 (mcl2p715), 85 to -515 (mcl2p515), 85 to -315 (mcl2p315), 85 to -115 (mcl2p115) or 85 to -115 with deletion of 16-35 (mcl2p53m). Their DNA deletions were confirmed by sequencing. The relative promoter activity from each construct was shown. C. Determination of p53 binding site in CCL2 5’UTR&promoter. U2OS cells were transfected with pcDNA3 alone or mp53WT alone without reporter gene as controls, or with various reporter genes alone (white bars): mcl2pwt, mcl2p715, mcl2p515, mcl2p315, mcl2p115 and mcl2p53m, or co-transfected with reporter genes plus 0.5μg pcDNA3 (gray bars) or plus 0.5μg mp53WT (black bars) overnight. The lysate from each experimental group was assessed by luciferase assay (n = 3). Values were normalized with respect to protein concentrations. Data are presented as mean ± SEM.
Fig. (3)
Fig. (3)
Diagram of mouse p53 deletions and their effects on the CCL2 promoter activity. A. Different lengths of p53 DNA were truncated and inserted into pcDNA3HA vector. Gray box: full length of p53. White boxes: deletions. The region representing amino acids of each cloned DNA was shown in boxes. Their DNA deletions were confirmed by sequencing. B. EMSA. A probe consisting of [32p]ATP-labeled cl2/p53oligo was added to each reaction buffer. Probe was alone (lane 1) or mixed with 1 μg of anti-HA immunoprecipitation (IP-p53 fusion protein of deletion 1, 2, 3, 4, 5, 6, 7, 8, 12, 13, 14 or wild-type clone 15, lane 2-13). The band shifts are indicated by arrows. C. Supershift assay 1. 32p-cl2/p53oligo probe was added to each reaction buffer and mixed with 1 μg of IP-p53 fusion protein (deletion 6, 7, 8, 13 or wild-type clone 15 in lane 1, 4, 7, 10, or 13) plus 1 pmol unlabeled competitor (lane 2, 5, 8, 11, or 14) or plus 1μg of HA antibody (lane 3, 6, 9, 12, or 15). The band shifts are indicated by arrows. D. Supershift assay 2. 32p-cl2/p53oligo probe was added to reaction buffer including 1 μg of IP-p53 fusion protein of deletion 9 (lanes 2-5), deletion 10 (lanes 6-9), or deletion 11 (lanes 10-13). The reaction buffer was then added with 1 μg of IP-p53 fusion protein of wild-type clone 15 (lanes 3-5, 7-9, and 11-13). The mixture was further added with 1 pmol unlabeled competitor (lane 4, 8, and 12) or 1μg HA antibody (lane 5, 9, and 13). The band shifts are indicated by arrows. E. EMSA. 32p-cl2/p53oligo probe (lanes 1-3) or 32p-SColigo probe as control (lanes 4-6) was added to each reaction buffer and mixed with 1 μg of IP-p53 fusion protein of wild-type clone 15 (lanes 2, 3, 5, or 6) plus 1 pmol unlabeled competitor (lane 3 or 6). The shifted bands are indicated by arrows.
Fig. (4)
Fig. (4)
Confirmation of a stable cell line integrated with a cloned DNA (mcl2p115/mCCL2wt/Luc). A. Schematic diagram of the cloned DNA (mcl2p115/mCCL2wt/Luc) integrated into chromosome of A549 cells (Named A5CLG). The arrows indicate the location and size of primers (Named primers A-F) used in PCR amplification of coding regions. These primer pairs were used for PCR and ChIP as described (Panels B&D). B. Detection of the cloned DNA by PCR. Chromosomal DNA isolated from A5CLG cells or A549 cells and mCCL2wt plasmid DNA as positive control were used as template for PCR with primer pairs (Bottom). The PCR-amplified specific DNAs with molecular weight of about 210bp, 200bp, 397bp or 513bp were run in a 1.5% agarose gel and imaged. C. Luciferase assay. Cell lysate from 1x10⁶ A5CLG cells or A549 cells as control was assessed by luciferase assay (n = 3). Values were normalized with respect to protein concentrations. D. ChIP-detection of protein-DNA interaction between p53 and CCL2 5’UTR&promoter. The PCR-amplified specific DNA fragments were indicated with arrows. E. Analysis of protein-mRNA interaction between p53 and CCL2 by RNA-IP. cDNA of A5CLG cells or A549 cells and mCCL2wt plasmid DNA as positive control were used as template for PCR with primer pairs (attached to bottom). RT-PCR-amplified DNA fragments are indicated with arrows.
Fig. (5)
Fig. (5)
The effect of p53 accumulation on luciferase gene expression via regulation of CCL2 promoter activity. The freshly splitting A5CLG cells or A549 cells as control were exposed to UV radiation and cells were harvested at different times (0 hr, 0.5 hr, 1 hr, 2 hr or 16 hr). The proteins and nuclear extracts from each experimental group were respectively purified and assessed (n = 3) for luciferase assay (A), Western blot (B), or ChIP (C). Values of luciferase assay were normalized with the relative ratio of ChIP assay. Western blot was performed with antibodies against p53 and actin as control and their values were normalized with respect to the corresponding actin bands. For ChIP assay, the nuclear extracts were further immunoprecipitated with p53 antibody and used as template for PCR with primer pairs (primerA&B). The PCR-amplified DNA fragments are indicated with arrows. Intensity of DNA band detected at 0 hr of UV exposure was assigned to a base value (100%). Intensity of other bands was calculated relative to this base value and their ratio is attached under the corresponding DNA band. D. Proteins from each group of cells co-transfected with mcl2p115 (No. 0-15) and p53 constructs (No. 1-15) or untreated as control were measured by luciferase assay (n = 3). Data are presented as mean ± SEM.
Fig. (6)
Fig. (6)
Effect of p53pep170 on gene expression in cells. A. Treatment for Bio-Plex and cell survival rate is described in the table. B. Bio-Plex assay. The cultured medium from each treated mouse primary macrophage cells group (table) was used and the major measurements were quantified (n=3) by Bio-Plex 200 System (Bio-Rad). Data are presented as mean ± SEM. Values were normalized with respect to the cell survival rate and protein concentrations. C. ELISA assay. Mouse primary macrophages (1 x 10⁶) from wild-type (white bars) or p53-deficient mice (grey bars) were stimulated with 0.1 μg/ml E. coli LPS alone, LPS plus different dosages of p53pep170 (5 μg/ml, 50 μg/ml or 100 μg/ml), and LPS with SCpep (100 μg/ml) as control. Their cultured media were used for ELISA (n=3). Data are presented as mean ± SEM. Values were normalized with respect to the cell survival rate and protein concentrations. D. Down-regulation of lentiCLG-induced CCL2 production by p53pep170 in both human primary monocytes and mouse primary macrophages. The human monocytes (Panels A-H) and mouse macrophages (I-P) were infected with LentiCLG (MOI=2) plus DMSO alone (A&E or I&M) or 10ug/ml p53pep170 (C&G or K&O) or 100ug/ml p53pep170 (D&H or L&P) or 100ug/ml Scpep (B&F or J&N) as the control. To test whether p53pep170 has an effect on suppression in lentivirus infection, human monocytes (Q&R) and mouse macrophages (S&T) were infected with Lenti6.3virus (MOI=2) plus 100ug/ml p53pep170. Cells were incubated for 37°C, 5% CO2 for 5 days. The phase contrast panels (A&E, B&F, C&G, D&H, I&M, J&N, K&O, L&P, Q&R, or S&T) were the pair of sections. The treated cells were exposed to visible light (A-D, I-L, Q&S) and to fluorescent light (E-H, M-P, R&T) using an Olympus BX40 microscope at 1000x magnification. The GFP-induced fluorescent signal in human primary monocytes (E-H, R) or in mouse primary macrophages (M-P, T) was observed. The images were taken with MicroFIRE camera under uniform exposure time: 30 msec for visible light (A-D, I-L, Q&S) and 1 sec for fluorescent light (E-H, M-P, R&T). The data analysis was processed by the program Image-Pro plus 5.0. Multiple tests have been done with similar results.

Similar articles

Cited by

  • Immune surveillance of unhealthy cells by natural killer cells.
    Iannello A, Raulet DH. Iannello A, et al. Cold Spring Harb Symp Quant Biol. 2013;78:249-57. doi: 10.1101/sqb.2013.78.020255. Epub 2013 Oct 17. Cold Spring Harb Symp Quant Biol. 2013. PMID: 24135717 Free PMC article. Review.
  • Oral bacteria and cancer.
    Whitmore SE, Lamont RJ. Whitmore SE, et al. PLoS Pathog. 2014 Mar 27;10(3):e1003933. doi: 10.1371/journal.ppat.1003933. eCollection 2014 Mar. PLoS Pathog. 2014. PMID: 24676390 Free PMC article. Review. No abstract available.
  • Deficiency of miR-208a Exacerbates CCl4-Induced Acute Liver Injury in Mice by Activating Cell Death Pathways.
    Bala S, Calenda CD, Catalano D, Babuta M, Kodys K, Nasser IA, Vidal B, Szabo G. Bala S, et al. Hepatol Commun. 2020 Aug 19;4(10):1487-1501. doi: 10.1002/hep4.1540. eCollection 2020 Oct. Hepatol Commun. 2020. PMID: 33024918 Free PMC article.
  • The role of p53 in anti-tumor immunity and response to immunotherapy.
    Carlsen L, Zhang S, Tian X, De La Cruz A, George A, Arnoff TE, El-Deiry WS. Carlsen L, et al. Front Mol Biosci. 2023 Aug 1;10:1148389. doi: 10.3389/fmolb.2023.1148389. eCollection 2023. Front Mol Biosci. 2023. PMID: 37602328 Free PMC article. Review.
  • Mechanisms of environmental chemicals that enable the cancer hallmark of evasion of growth suppression.
    Nahta R, Al-Mulla F, Al-Temaimi R, Amedei A, Andrade-Vieira R, Bay SN, Brown DG, Calaf GM, Castellino RC, Cohen-Solal KA, Colacci A, Cruickshanks N, Dent P, Di Fiore R, Forte S, Goldberg GS, Hamid RA, Krishnan H, Laird DW, Lasfar A, Marignani PA, Memeo L, Mondello C, Naus CC, Ponce-Cusi R, Raju J, Roy D, Roy R, Ryan EP, Salem HK, Scovassi AI, Singh N, Vaccari M, Vento R, Vondráček J, Wade M, Woodrick J, Bisson WH. Nahta R, et al. Carcinogenesis. 2015 Jun;36 Suppl 1(Suppl 1):S2-18. doi: 10.1093/carcin/bgv028. Carcinogenesis. 2015. PMID: 26106139 Free PMC article. Review.

References

    1. Ghosh A, Stewart D, Matlashewski G. Regulation of human p53 activity and cell localization by alternative splicing. Mol Cell Biol. 2004;24:7987–97. - PMC - PubMed
    1. Rohaly G, Chemnitz J, Dehde S, et al. A novel human p53 isoform is an essential element of the ATR-intra-S phase checkpoint. Cell. 2005;122:21–32. - PubMed
    1. Virginie M, Staphane P, Mustapha A, et al. Delta160p53 is a novel N-terminal p53 isoform encoded by delta133p53 transcript. FEBS Lett. 2010;584:4463–8. - PubMed
    1. Avery-Kiejda KA, Zhang XD, Adams LJ, et al. Small molecular weight variants of p53 are expressed in human melanoma cells and are induced by the DNA-damaging agent cisplatin. Clin Cancer Res. 2008;14:1659–68. - PubMed
    1. Hofstetter G, Berger A, Fiegl H, et al. Aoternative splicing of p53 and p73: the novel p53 splice variant p53 delta is an independent prognostic marker in ovarian cancer. Oncogene. 2010;29:1997–2004. - PubMed

Publication types

MeSH terms