. 2012 Aug 7;107(4):684-94.
doi: 10.1038/bjc.2012.294. Epub 2012 Jul 17.

Enhanced stability of microRNA expression facilitates classification of FFPE tumour samples exhibiting near total mRNA degradation

Affiliations

Enhanced stability of microRNA expression facilitates classification of FFPE tumour samples exhibiting near total mRNA degradation

J S Hall et al. Br J Cancer. .

Abstract

Background: As degradation of formalin-fixed paraffin-embedded (FFPE) samples limits the ability to profile mRNA expression, we explored factors predicting the success of mRNA expression profiling of FFPE material and investigated an approach to overcome the limitation.

Methods: Bladder (n=140, stored 3-8 years) and cervix (n=160, stored 8-23 years) carcinoma FFPE samples were hybridised to Affymetrix Exon 1.0ST arrays. Percentage detection above background (%DABG) measured technical success. Biological signal was assessed by distinguishing cervix squamous cell carcinoma (SCC) and adenocarcinoma (AC) using a gene signature. As miR-205 had been identified as a marker of SCC, precursor mir-205 was measured by Exon array and mature miR-205 by qRT-PCR. Genome-wide microRNA (miRNA) expression (Affymetrix miRNA v2.0 arrays) was compared in eight newer FFPE samples with biological signal and eight older samples without.

Results: RNA quality controls (QCs) (e.g., RNA integrity (RIN) number) failed to predict profiling success, but sample age correlated with %DABG in bladder (R=-0.30, P<0.01) and cervix (R=-0.69, P<0.01). Biological signal was lost in older samples and neither a signature nor precursor mir-205 separated samples by histology. miR-205 qRT-PCR discriminated SCC from AC, validated by miRNA profiling (26-fold higher in SCC; P=1.10 × 10(-5)). Genome-wide miRNA (R=0.95) and small nucleolar RNA (R=0.97) expression correlated well in the eight newer vs older FFPE samples and better than mRNA expression (R=0.72).

Conclusion: Sample age is the best predictor of successful mRNA profiling of FFPE material, and miRNA profiling overcomes the limitation of age and copes well with older samples.


Conflict of interest statement

The authors declare no conflict of interest.

Figures

Figure 1
Figure 1
RNA quality affects the technical success of Affymetrix Exon arrays. (A) Table displaying the correlation coefficients (R) between RNA quantification and QCs against %DABG; RIN number, 260/230 ratio, 260/280 ratio and concentration. Complementary DNA yield following NuGen amplification was also considered as a surrogate for RNA quality. Emboldened values show significant P-values: *P<0.05, **P<0.01. (B) Table displaying the median RNA quantification and QC values for the bladder cancer cohort (n=125) and the combined cervix cancer cohort (n=139). Brackets indicate range. (C) Bioanalyser traces showing intact cell line RNA (MCF10A) with an RIN number of 10 and a representative cervix FFPE sample (V554) with a RIN of 2.10. Fragment size is on x axis (migration time in seconds), with abundance (fluorescent units) shown on the y axis. Formalin-fixed paraffin-embedded samples show loss of the 18S and 28S ribosomal subunit peaks seen in the cell line RNA. (D) xy scatterplot showing %DABG against age of FFPE block (in years) for the bladder cancer cohort. The plotted line represents a line of best fit. (E) x–y scatterplot showing %DABG against age of FFPE block (in years) for the cervix cancer cohort. The plotted line represents a line of best fit.
Figure 2
Figure 2
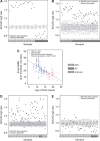
Application of a signature capable of discriminating AC from SCC to the cervix cancer cohort. The ratio of the median expression of 1062 genes associated with SCC divided by the median expression of 155 genes associated with AC (Hall et al, 2011) is plotted per sample (black circles). Five hundred bootstraps of a random selection of genes of the same size are also plotted (grey circles). The bar indicates sample histology. Squamous cell carcinoma samples are indicated by the vertical lines, AC by the spotted grey bar and samples with pathologically undefined/unclear histology are represented by horizontal bars. (A) Applied to the original (training) cohort (n=28) of AC/SCC samples (Hall et al, 2011). Samples in this FFPE cohort have a median age of 11 years (10–16) (B) Applied to the independent non-small-cell lung cancer (NSCLC) cohort (Hall et al, 2011). The samples in this cohort were fresh-frozen. (C) Partitioning of the samples into two independent cohorts on the basis of historical partitioning. Cervix series 1 (squares) indicate the younger cervix series one (median age 12 years (8–18)) and CS2 (stars) indicate cervix series two (median age 18 years (16–23)). (D) AC/SCC signature applied to the CS1 cohort (of similar age to the original training samples). (E) AC/SCC signature applied to CS2, an older independent cohort of cervix cancer samples.
Figure 3
Figure 3
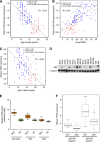
The age of the FFPE block is associated with loss of biological signal. (A) xy scatterplot showing the ratio of SCC/AC gene signature (y axis) against the age of FFPE block in years (x axis). Pearson correlation coefficient (R) is displayed. (B) xy scatterplot showing the ratio of SCC/AC gene expression (y axis) against %DABG (x axis). Pearson correlation coefficient (R) is displayed. (C) xy scatterplot showing median TP63 expression plotted against the age of the FFPE block. Pearson correlation coefficient (R) is displayed. (D) Western blot of p63 protein expression in 16 cervix cancer cell lines. (E) Box-whisker plot showing Exon array probeset expression of TP63 in AC and SCC from three cohorts; cervix cell lines (n=16), CS1; intermediate age FFPE (n=112) and CS2; old FFPE n=48. (F) Box-whisker plot for a subset of FFPE samples where sufficient tissue was available for p63 immunohistochemistry (CS1 n=108, CS2 n=44). y axis shows the median TP63 probeset expression from Exon array data. x axis shows p63 immunohistochemistry status; positive (>5% nuclei) or negative (<5% nuclei) for samples within the younger CS1 and older CS2 cohorts.
Figure 4
Figure 4
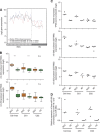
Expression of miRNA hsa-miR-205 can discriminate between AC and SCC in poor-quality samples. (A) Graph showing the median probeset expression of TP63 and two probesets representing hsa-mir-205 in the original training set for the AC/SCC signature (Hall et al, 2011). Vertical bars indicate SCC samples. Hatched line indicates the split between SCC and AC samples (B) Box-whisker plot showing expression of two probesets (2377992) and (2377993) representing hsa-mir-205 expression across the three series; cell lines, CS1 and CS2 FFPE cohorts. T-test P-values are shown as: **P<0.01. ***P<0.001. n.s., not significant (C) Graph showing the expression of TP63, hsa-mir-205 (2377992) and hsa-mir-205 (2377993) from the Exon array data across a subset of samples randomly selected from the three series; cell lines, intermediate age FFPE (CS1), old FFPE (CS2). Each value represents an individual sample and the horizontal bar displays the median. (D) Taqman qRT–PCR data showing the relative expression of hsa-miR-205 normalised to hsa-miR-16.1 and hsa-miR-26b expression across the random subsets from the three series; cell lines, CS1 and CS2 FFPE samples. Each value represents an individual sample and the bar displays the median.
Figure 5
Figure 5
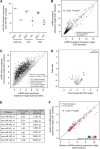
Global microRNAome profiling confirms that microRNAs have enhanced stability in FFPE samples. (A) Affymetrix miRNA 2.0 array data for probeset hsa_miR-205_st. Each point represents an independent sample and the horizontal bar indicates the median. Eight samples were hybridised from the younger CS1 cohort (four AC and four SCC) and eight samples were hybridised from the older CS2 cohort (four AC and four SCC) along with a single example of SCC and AC cell line RNA. (B) xy scatterplot showing the miRNA (miRNA 2.0 array) median probeset expression values for all 1105 miRNA probes. y-axis values are the median of eight CS1 samples and x-axis values are the median of eight CS2 samples. Pearson correlation coefficient (R) is displayed. (C) xy scatterplot showing the mRNA (Exon array)-derived median probeset expression for 1000 randomly selected probesets (grey) and 2395 SCC-specific probesets derived from the AC/SCC signature (hollowed circles). y-axis values are the median of eight CS1 samples and x-axis values are the median of eight CS2 samples. Pearson correlation coefficient (R) is displayed. (D) Volcano plot showing the results of LIMMA differential expression analysis between eight SCC and eight AC samples. x axis represents fold change (log2) and the y axis details LIMMA odds ratio, a measure of statistical change. Probesets with positive or negative fold change less than twofold (log2=1) are coloured grey. Probesets with a fold change greater than twofold are coloured black. Star-shaped data points represent statistically significant probesets with an FDR-adjusted P-value <0.05. (E) Table listing differentially expressed probesets with a log2 fold change ⩾1.5 fold. (F) xy scatterplot showing the snoRNA median probeset, expression values for all 510 snoRNA, CDbox and HAcaBox probes (miRNA 2.0 array). y-axis values are the median of eight CS1 samples and x-axis values are the median of eight CS2 samples. Gradient colouring is based on the size of the target molecule, between 48 nt (blue) and 250 nt (red). Pearson correlation coefficient (R) is displayed.

References

    1. Abdueva D, Wing M, Schaub B, Triche T, Davicioni E (2010) Quantitative expression profiling in formalin-fixed paraffin-embedded samples by affymetrix microarrays. J Mol Diagn 12: 409–417 - PMC - PubMed
    1. Abramovitz M, Barwick BG, Willis S, Young B, Catzavelos C, Li Z, Kodani M, Tang W, Bouzyk M, Moreno CS, Leyland-Jones B (2011) Molecular characterisation of formalin-fixed paraffin-embedded (FFPE) breast tumour specimens using a custom 512-gene breast cancer bead array-based platform. Br J Cancer 105: 1574–1581 - PMC - PubMed
    1. Benjamini Y, Hochberg Y (1995) Controlling the false discovery rate: a practical and powerful approach to multiple testing. J R Stat Soc Ser B 57: 289–300
    1. Blow N (2007) Tissue preparation: tissue issues. Nature 448: 959–963 - PubMed
    1. Cassidy SB, Schwartz S, Miller JL, Driscoll DJ (2012) Prader-Willi syndrome. Genet Med 14: 10–26 - PubMed

Publication types