. 2012 Jul;24(7):2979-91.
doi: 10.1105/tpc.111.094532. Epub 2012 Jul 17.

N-terminal structure of maize ferredoxin:NADP+ reductase determines recruitment into different thylakoid membrane complexes

Affiliations

N-terminal structure of maize ferredoxin:NADP+ reductase determines recruitment into different thylakoid membrane complexes

Manuel Twachtmann et al. Plant Cell. 2012 Jul.

Abstract

To adapt to different light intensities, photosynthetic organisms manipulate the flow of electrons through several alternative pathways at the thylakoid membrane. The enzyme ferredoxin:NADP(+) reductase (FNR) has the potential to regulate this electron partitioning because it is integral to most of these electron cascades and can associate with several different membrane complexes. However, the factors controlling relative localization of FNR to different membrane complexes have not yet been established. Maize (Zea mays) contains three chloroplast FNR proteins with totally different membrane association, and we found that these proteins have variable distribution between cells conducting predominantly cyclic electron transport (bundle sheath) and linear electron transport (mesophyll). Here, the crystal structures of all three enzymes were solved, revealing major structural differences at the N-terminal domain and dimer interface. Expression in Arabidopsis thaliana of maize FNRs as chimeras and truncated proteins showed the N-terminal determines recruitment of FNR to different membrane complexes. In addition, the different maize FNR proteins localized to different thylakoid membrane complexes on expression in Arabidopsis, and analysis of chlorophyll fluorescence and photosystem I absorbance demonstrates the impact of FNR location on photosynthetic electron flow.


Figures

Figure 1.
Figure 1.
Variable Cellular and Subcellular Locations of Maize FNR Proteins. (A) Cellular distribution of FNR isoproteins. Chlorophyll and proteins were extracted from total leaves (T) or mesophyll cells (MC) and bundle sheath cells (BSC) isolated from mature maize leaves. Chlorophyll a/b ratios ± sd of three independent measurements were calculated, and protein extracts were separated by SDS-PAGE before immunoblotting to detect the indicated proteins. Lanes were loaded with equal protein, either 4 µg for detection of FNR and NADP-MDH or 0.5 µg for detection of the large subunit of ribulose-1,5-bis-phosphate carboxylase/oxygenase (RuBisCO). Antisera used are indicated to the left of the blots. Migration position of the different maize FNR isoproteins, as established previously (Okutani et al., 2005), is indicated to the right of the αFNR blot. (B) Subchloroplast location of FNR isoproteins. Proteins from bundle sheath and mesophyll cells were separated into membrane (M) and soluble (S) fractions and loaded on the gel to give equivalent ratios of membrane to soluble extract. Twenty micrograms of protein from bundle sheath cell extracts and 4 µg protein from mesophyll cell extracts were loaded on the gel and immunoblotted to detect FNR. Migration position of the different maize FNR isoproteins, as established previously (Okutani et al., 2005), is indicated to the right of the blot.
Figure 2.
Figure 2.
Transformation of Arabidopsis with Maize FNR Isoproteins. (A) Arabidopsis transformed with maize FNR proteins. Genes encoding maize FNR1 (Zm-FNR1), FNR2 (Zm-FNR2), and FNR3 (Zm-FNR3) were cloned and used to stably transform wild-type (wt) Arabidopsis under control of the Arabidopsis FNR1 promoter. Crude protein extracts were made from leaves of the transformants and assayed for FNR activity, measured as ferredoxin-dependent cytochrome c reduction in crude protein extracts from leaves of the wild type and two independent Arabidopsis lines overexpressing Zm-FNR1, Zm-FNR2, and Zm-FNR3. Values are means ± se of three independent measurements. (B) Phenotype of Zm-FNR transgenics. Typical representative plants of two independent lines expressing either Zm-FNR1, Zm-FNR2, or Zm-FNR3 are shown following 10 weeks of growth. (C) Subcellular location of Zm-FNR proteins in Arabidopsis. Crude extracts from the wild type and representative Zm-FNR1–, Zm-FNR2–, and Zm-FNR3–expressing lines were separated into soluble (S) and membrane (M) protein fractions. For each sample, 20 µg of total protein was divided into S and M fractions with equal volume, before native-PAGE, and immunoblotting with an antibody raised against Zm-FNR2. Position of native Arabidopsis FNR1 (At-FNR1) and FNR2 (At-FNR2) proteins is indicated to the left of the blot. Positions of introduced Zm-FNR proteins are indicated to the right of the blot. (D) Recruitment of maize FNR proteins into Arabidopsis thylakoid membrane complexes. Chloroplasts were isolated from the wild type and representative Arabidopsis lines expressing the maize FNR genes. Thylakoid membranes were extracted, digested, and subjected to blue native-PAGE (BNP) before immunoblotting and detection of FNR-containing complexes. Samples were loaded on an equal chlorophyll basis, with 4 µg per lane. Left panel shows the blue native-PAGE gel following the run, with major native complexes indicated to the left of the gel. Right panel shows an immunoblot of the gel, detected with an antibody raised against maize FNR2, with FNR-containing complexes indicated to the right of the blot. Position of molecular mass markers is indicated between the gel and the blot in kilodaltons.
Figure 3.
Figure 3.
Structural Variation at the N-Terminal and Homodimer Interface of Maize FNR Proteins. Maize FNR1, FNR2, and FNR3 were expressed recombinantly as mature proteins, purified, and crystallized. (A) Crystal structures of single FNR molecules. Structures are shown as ribbon with α-helices in red and β-sheets in yellow. The FAD moiety is shown in blue. Lower resolution of structure is indicated by the green and red dotted lines representing parts of the Zm-FNR2 and Zm-FNR3 N termini. (B) Arrangement of Zm-FNR homodimers. Structures are shown as a ribbon with α-helices in red and β-sheets in yellow. In the Zm-FNR1 structure, N termini of two adjacent Zm-FNR1 molecules are shown in either white or blue balls and sticks. (C) to (E) Charge distribution at the interface of Zm-FNR homodimers (red, area of acidic charge; blue, area of basic charge). Charge distribution on space-filled homodimers of Zm-FNR1 (C), Zm-FNR2 (D), and pea FNR (E) (taken from Alte et al., 2010). The dimer structure is shown in the center, composed of two monomers ([A] and [B]). To the left and right of each dimer, the constituent FNRA and FNRB monomers of each dimer are shown rotated through 90° to display the surface area of interaction. In the structure of Zm-FNR1, the N termini of other Zm-FNR1 molecules adjacent to the dimer in the crystal matrix insert into the dimer interface. These adjacent FNR molecules are labeled FNR1A′ and FNR1B′ and are shown as ball and stick models in white (FNR1 A′) and blue (FNR1 B′). The location of the 27–amino acid fragment of Tic62 in the structure of the pea FNR structure is shown in a yellow ball and stick model.
Figure 4.
Figure 4.
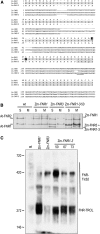
Impact of Chimeric N-Terminal Exchange between Maize FNR Proteins. (A) Construction of chimeric Zm-FNR1-3. Amino acid sequence alignment, comparing Zm-FNR1 (black on white) and Zm-FNR3 (black on gray) with chimeric Zm-FNR1-3, in which the Zm-FNR1 N-terminal sequence was exchanged for that of Zm-FNR3. Chimeras were created to exchange the transit peptides and amino acids perpendicular to the surface of Zm-FNR1 in the structure shown in Figure 3. The first amino acids of the mature proteins are indicated as white lettering on black. (B) Detection of chimeric Zm-FNR1-3 proteins expressed in transgenic Arabidopsis. Plants were stably transformed with the chimeric Zm-FNR1-3 construct under control of the At-FNR1 promoter. Protein extracts were made from Arabidopsis wild-type (wt), Zm-FNR1, and Zm-FNR3–expressing plants, and a representative line expressing Zm-FNR1-3. For each sample, 20 µg of total protein was divided into S and M fractions with equal volume, before native-PAGE and immunoblotting with an antibody raised against Zm-FNR2. Positions of native Arabidopsis FNR1 (At-FNR1) and FNR2 (At-FNR2) proteins are indicated to the left of the blot. Positions of introduced Zm-FNR proteins are indicated to the right of the blot. (C) Assembly of Zm-FNR1-3 into thylakoid membrane complexes. Thylakoid membrane protein complexes from Arabidopsis wild type, transgenics expressing Zm-FNR1 or Zm-FNR3, and three independent lines overexpressing Zm-FNR1-3 were solubilized and subjected to blue native-PAGE (BNP) before immunoblotting and detection of FNR-containing complexes. Samples loaded contained 4 µg chlorophyll per lane, except the wild type, which was loaded as 2 µg per lane. Approximate molecular masses are given in kilodaltons to the left of the blot, and FNR-containing complexes coordinated by Tic62 and TROL are indicated to the right of the blot.
Figure 5.
Figure 5.
Impact of N-Terminal Truncation on Maize FNR1 Assembly into Thylakoid Membrane Complexes. (A) Truncation of maize FNR1 sequence. Alignment comparing the N-terminal portion of the native (Zm-FNR1) and truncated (Zm-FNR1t) nucleotide and amino acid sequences. The Zm-FNR1 sequence was truncated to retain the transit peptide, while shortening the mature protein sequence by 14 amino acids that are perpendicular to the surface of the protein in the structure shown in Figure 3. The first amino acid of the mature Zm-FNR1 protein is indicated as white lettering on black. (B) Detection of the mature, truncated Zm-FNR1 protein expressed in transgenic Arabidopsis. Plants were stably transformed with the truncated Zm-FNR1t construct under control of the At-FNR1 promoter. Protein extracts were made from Arabidopsis wild type (wt), one representative line expressing Zm-FNR1, and one representative line expressing Zm-FNR1t (Zm-FNR1t-7). For each sample, 20 µg of total protein was divided into soluble (S) and membrane-bound (M) fractions, before SDS-PAGE, and immunoblotting with an antibody raised against maize FNR2. Position of native Arabidopsis FNR proteins (At-FNR1 + At-FNR2) is indicated to the left of the blots, and positions of introduced Zm-FNR1 and Zm-FNR1t are indicated to the right of the blots. (C) Assembly of Zm-FNR1t into thylakoid membrane complexes. Thylakoid membrane protein complexes from Arabidopsis wild type, transgenics expressing Zm-FNR1, and two independent lines overexpressing Zm-FNR1t were solubilized and subjected to blue native-PAGE (BNP) before immunoblotting and detection of FNR-containing complexes. Samples loaded contained 4 µg chlorophyll per lane. Approximate molecular masses are given in kilodaltons to the left of the blot, and FNR-containing complexes coordinated by Tic62 and TROL are indicated to the right of the blot.
Figure 6.
Figure 6.
PET in Arabidopsis with FNR Enriched in Soluble, TROL-Bound, or Tic62-Bound FNR. Electron transport parameters of Arabidopsis wild type (closed triangles) and representative lines expressing either Zm-FNR1 (Zm-FNR1-5, open boxes), Zm-FNR2 (Zm-FNR2-2, open triangles), or Zm-FNR3 (Zm-FNR3-4, open circles) over light induction. Plants were dark adapted before exposure to growth light intensity actinic light. Saturation pulses were given at the indicated times for calculation of the indicated parameters. Values are means ± se of measurements on mature leaves from five to six different individuals, and the experiment was repeated three times with basically the same result. The experiment was also repeated with other lines expressing the same genes to confirm tendencies.
Figure 7.
Figure 7.
The Contribution of Rigid N-Terminal Structure and TROL Binding Domain Amino Acid Composition to Membrane Recruitment of Maize FNR. This model summarizes structural and transgenic results indicating that both FNR N-terminal structure and amino acid composition of the interaction site with TROL contribute to membrane recruitment of FNR in maize and is based on the assumption that FNR:FNR binding protein interactions are dependent on FNR dimerization. The structure of Zm-FNR1 shows N termini of adjacent FNR molecules helping to coordinate dimer formation. The basic charge (blue shading) distribution at the Zm-FNR1 homodimer interface causes a strong interaction with TROL. Preformation of a dimer in solution promotes dimerization around the TROL peptide at the membrane, with the strongly interacting FNR binding domain of TROL displacing the N termini of other Zm-FNR1 molecules. In the Zm-FNR3 structure, the more flexible N terminus does not contribute to preformation of a dimer. In addition, the TROL binding site is surrounded by more acidic amino acids (red shading), and these factors preclude Zm-FNR3 recruitment to the membrane. When the N terminus of Zm-FNR1 is added to Zm-FNR3, this favors preformation of a dimer, promoting recruitment of Zm-FNR1-3 to TROL. When the N terminus of Zm-FNR1 is truncated, dimer formation is less likely, and binding to TROL is therefore weakened. However, the basic amino acids in the TROL binding domain enable Zm-FNR1t to retain some TROL binding.

References

    1. Alte F., Stengel A., Benz J.P., Petersen E., Soll J., Groll M., Bölter B. (2010). Ferredoxin:NADPH oxidoreductase is recruited to thylakoids by binding to a polyproline type II helix in a pH-dependent manner. Proc. Natl. Acad. Sci. USA 107: 19260–19265 - PMC - PubMed
    1. Andersen B., Scheller H.V., Møller B.L. (1992). The PSI-E subunit of photosystem I binds ferredoxin:NADP+ oxidoreductase. FEBS Lett. 311: 169–173 - PubMed
    1. Arnon D.I., Tagawa K., Tsujimoto H.Y. (1963). Role of ferredoxin in the energy conversion process of photosynthesis. Science 140: 378. - PubMed
    1. Baniulis D., Zhang H., Zakharova T., Hasan S.S., Cramer W.A. (2011). Purification and crystallization of the cyanobacterial cytochrome b6f complex. Methods Mol. Biol. 684: 65–77 - PubMed
    1. Benz J.P., Lintala M., Soll J., Mulo P., Bölter B. (2010). A new concept for ferredoxin-NADP(H) oxidoreductase binding to plant thylakoids. Trends Plant Sci. 15: 608–613 - PubMed

Publication types

MeSH terms

LinkOut - more resources