. 2012 Aug;71(8):729-40.
doi: 10.1097/NEN.0b013e3182625c02.

Cell of origin determines tumor phenotype in an oncogenic Ras/p53 knockout transgenic model of high-grade glioma

Affiliations

Cell of origin determines tumor phenotype in an oncogenic Ras/p53 knockout transgenic model of high-grade glioma

Sabah O Ghazi et al. J Neuropathol Exp Neurol. 2012 Aug.

Abstract

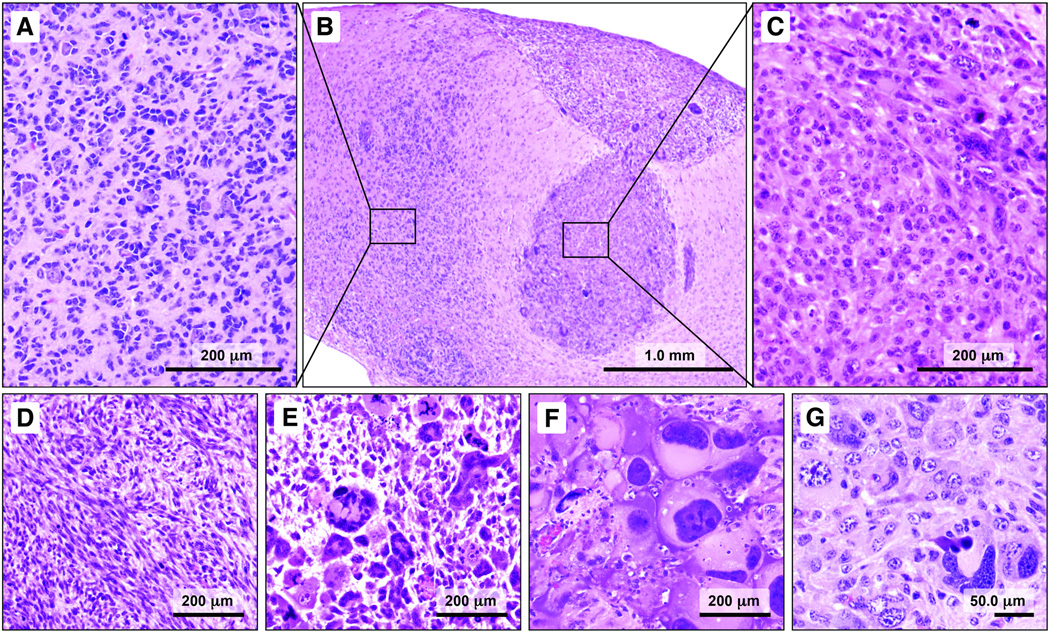
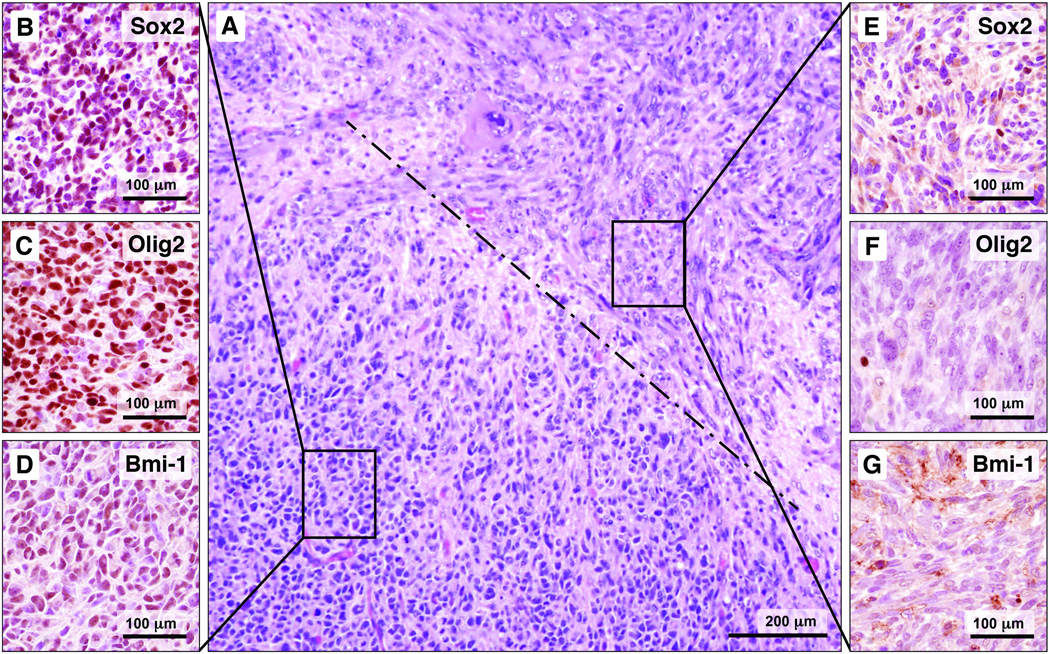
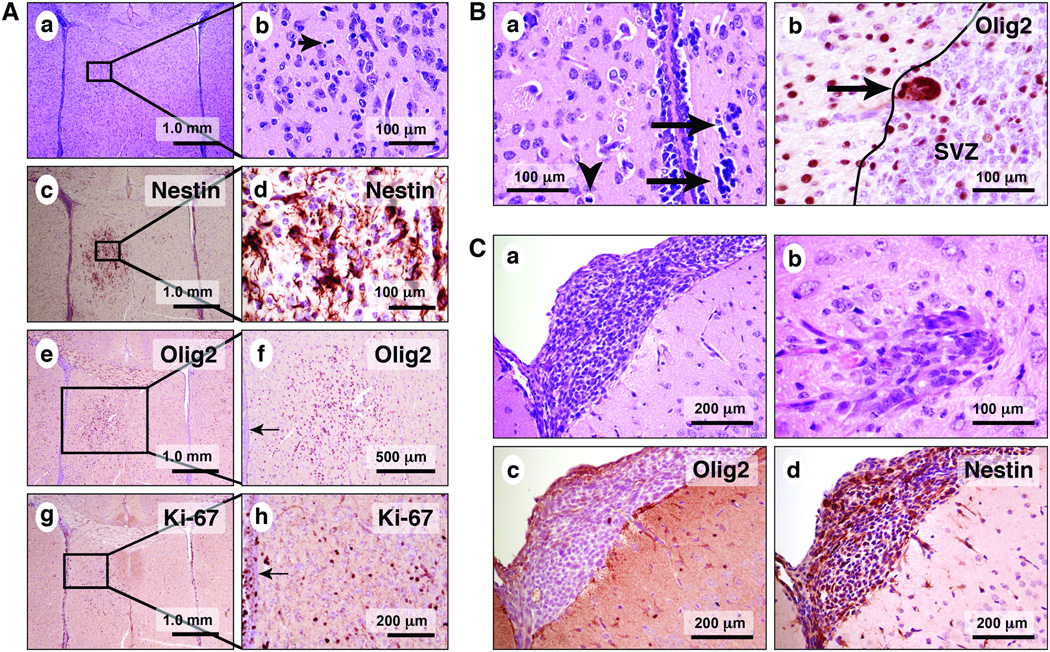
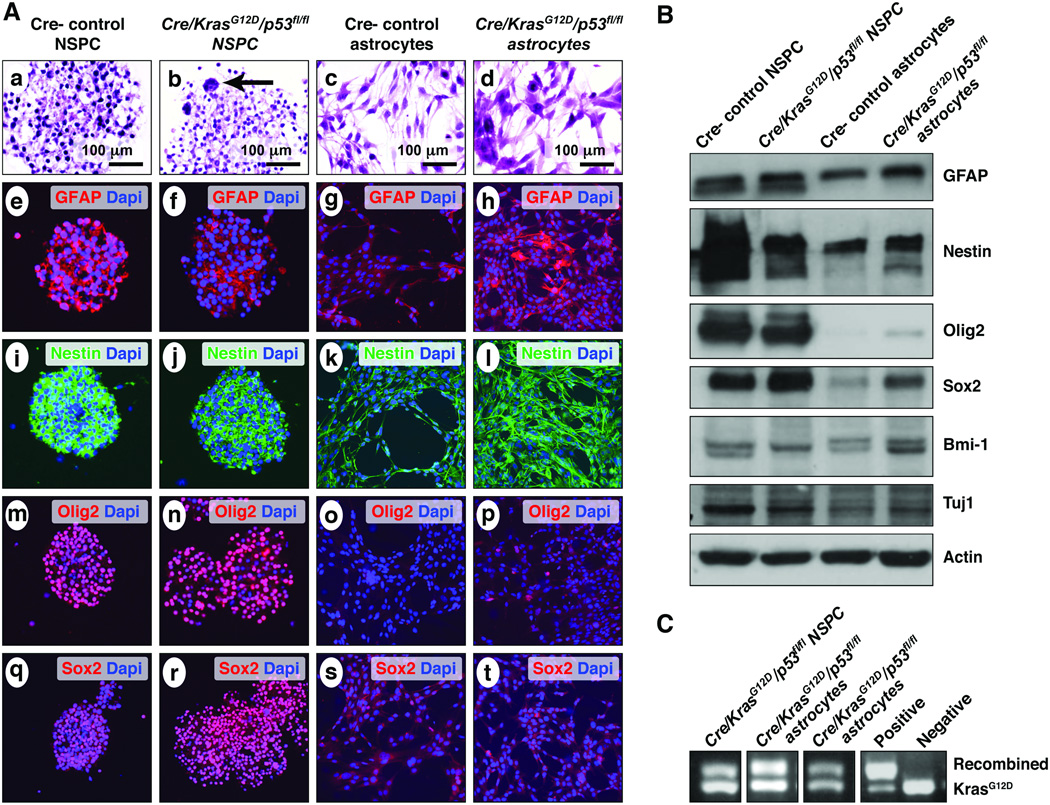
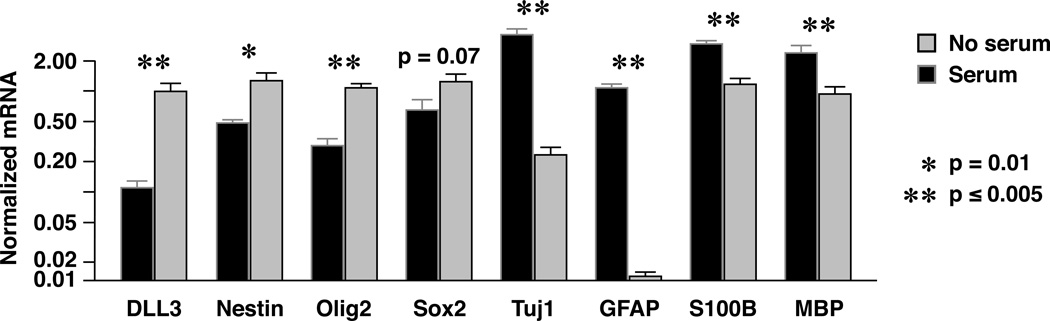
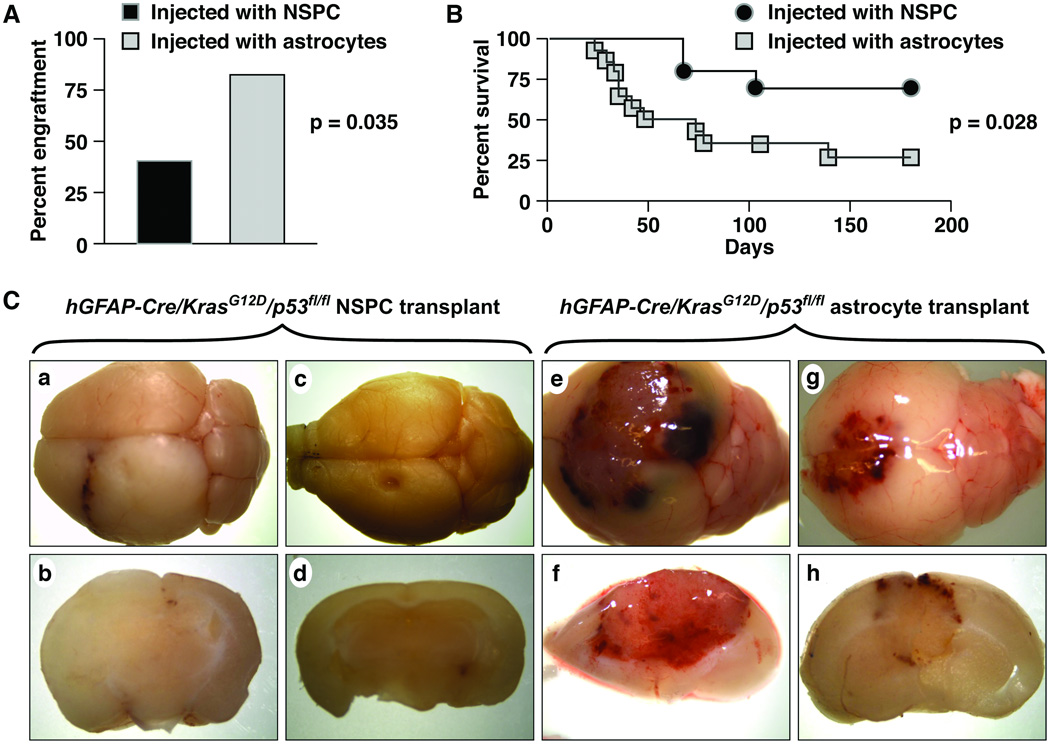
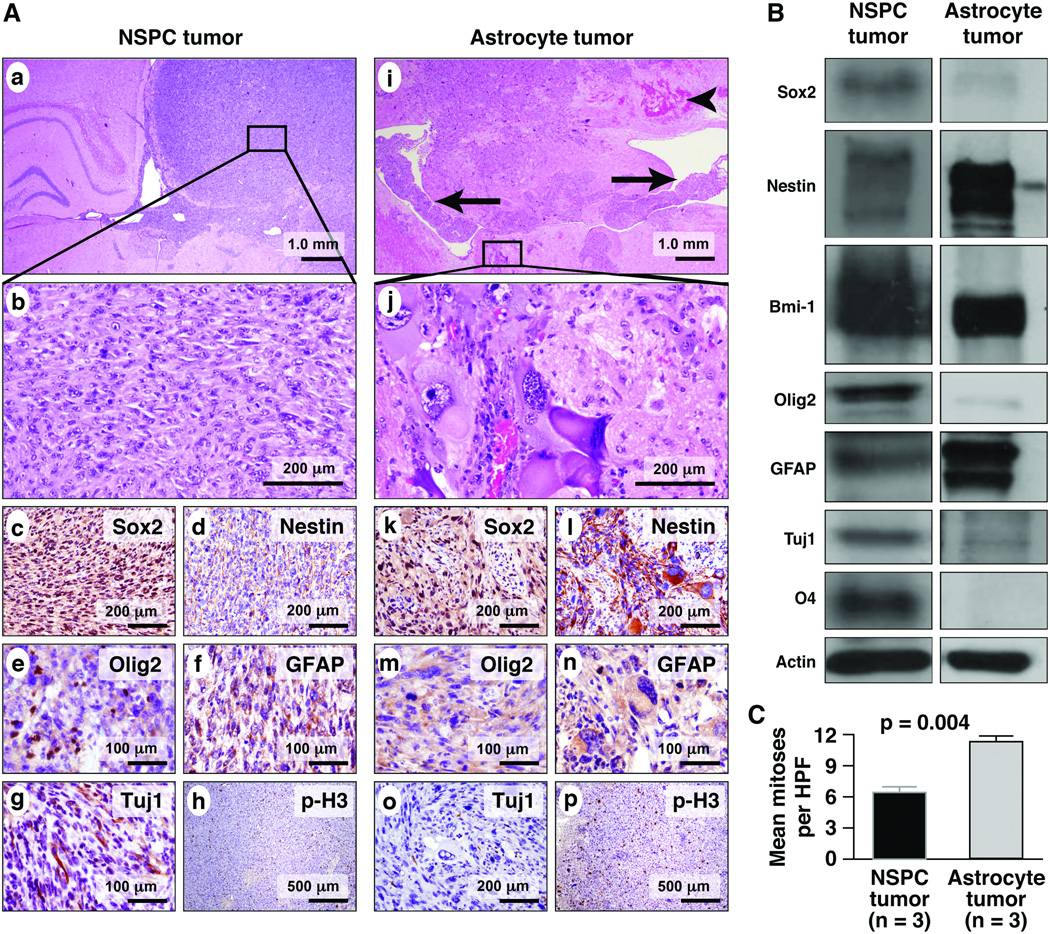
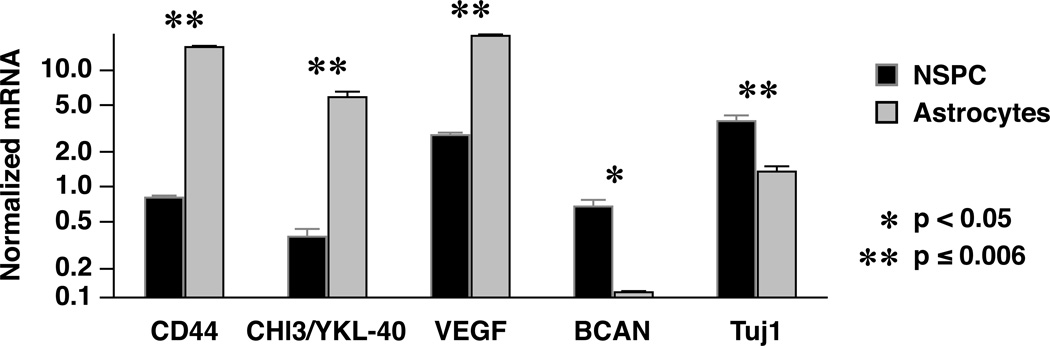
Human high-grade gliomas (HGGs) are known for their histologic diversity. To address the role of cell of origin in glioma phenotype, transgenic mice were generated in which oncogenic Ras and p53 deletion were targeted to neural stem/progenitor cells (NSPCs) and mature astrocytes. The hGFAP-Cre/Kras/p53 mice develop multifocal HGGs that vary histopathologically and with respect to the expression of markers associated with NSPCs. One HGG pattern strongly expressed markers of NSPCs and arose near the subventricular zone. Additional nonoverlapping patterns that recapitulate human HGG variants were present simultaneously in the same brain. These neoplastic foci were more often cortical or leptomeningeal based, and the neoplastic cells lacked expression of NSPC markers. To determine whether cell of origin determines tumor phenotype, astrocytes and NSPCs were harvested from neonatal mutant pups. Onorthotopic transplantation, early-passage astrocytes and NSPCs formed tumors that differed in engraftment rates, latency to clinical signs, histopathology, and protein expression. Astrocyte-derivedtumors were more aggressive, had giant-cell histology, and glial fibrillary acidic protein expression. The NSPC-derived tumors retained NSPC markers and showed evidence of differentiation along astrocytic, oligodendroglial, and neuronal lineages. These results indicate that identical tumorigenic stimuli produce markedly different glioma phenotypes, depending on the differentiation status of the transformed cell.


Figures

Figure 1
Figure 1
Multiple high-grade gliomas (HGGs) phenotypes are recapitulated in a single hGFAP-Cre/KrasG12D/p53fl/fl mouse. (A–G) One pattern (type A) consists of cells with small angular nuclei and scant cytoplasm (A, B). Satellitosis of overrun, normal appearing neurons and blood vessels is prominent in this pattern. An adjacent focus is composed of neoplastic cells that resemble the large cells of human gemistocytic astrocytoma (B, C). In other areas, the tumor cells are distinctly spindled and arranged in fascicles (D). Variations in a giant cell pattern also were observed, with bizarre, multinucleated cells with abundant eosinophilic cytoplasm (E, F). Other areas showed strikingly pleomorphic nuclei, basophilic cytoplasm, and less distinct cell borders (G).
Figure 2
Figure 2
The high-grade gliomas (HGGs) patterns are geographically distinct; the type A pattern is distinguished from other patterns by expression of markers associated with neural stem/progenitor cells (NSPCs) and glioma stem cells. (A) A photomicrograph at intermediate magnification shows a focus of type A pattern juxtaposed to the spindle cell pattern; the dashed line indicates the border between the patterns. (B–D) The type A pattern shows nuclear labeling for Sox2, Olig2, and Bmi-1 (brown reaction product). (E–G) The adjacent spindle cell pattern largely lacks nuclear immunoreactivity for these markers.
Figure 3
Figure 3
Microscopic tumor foci are present in hGFAP-Cre/KrasG12D/p53fl/fl pup brains as early as post-natal day 17. (A) The type A pattern is frequently found near the ventricles (a–h). (B) Cytologically malignant (a, arrows) and mitotically active cells (a, arrowhead) are present in association with the ependymal lining and the SVZ. The atypical cells are immunoreactive for Olig2 (b, arrow). Tumor patterns other than type A are found in 17-day-old pups, including those with leptomeningeal (a) and cortical involvement (b). Unlike the cells of the type A pattern, the leptomeningeal tumor cells in 3B are negative for Olig2 (c), although they are positive for nestin (d, brown reaction product).
Figure 4
Figure 4
Characterization of neurospheres and astrocytes harvested from control and mutant neonatal pups. (A) Cells harvested from forebrain periventricular areas of both wild type and mutant neonatal mice formed robust neurospheres (a, b). Neurospheres from hGFAP-Cre/KrasG12D/p53fl/fl mice are distinguished from controls on hematoxylin and eosin stain by the presence of scattered, frankly atypical, occasionally multinucleated cells (b, arrow). Cortical astrocytes from wild type and mutant pups showed fibrillary processes and often bipolar morphology under adherent conditions (c, d). Both control (e, i, m, q) and mutant neurospheres (f, j, n, r) strongly express neural stem/progenitor cells (NSPC) markers, including glial fibrillary acidic protein (GFAP), nestin, Olig2, and Sox2. In comparison, wild-type astrocytes showed moderate GFAP expression, weak nestin expression and virtually no Olig2 or Sox2 expression (g, k, o, s). Astrocytes from hGFAP-Cre/KrasG12D/p53fl/fl pups, compared to control astrocytes, show similar GFAP expression, increased nestin expression, and scattered Olig2- and Sox2-immunoreactive nuclei (h, l, p, t). (B) Western blot analysis confirmed the results of the immunofluorescent studies for GFAP, nestin, Olig2 and Sox2. Bmi-1 expression was strongest in the mutant astrocytes (4th lane); Tuj1 expression was strongest in control neurospheres (1st lane). (C) PCR shows the presence of the recombined KrasG12D allele in a neurosphere line and in 2 adherent astrocyte lines.
Figure 5
Figure 5
Mutant neural stem/progenitor cells (NSPCs) exposed to serum-containing medium show downregulation of gene expression for stemness markers and upregulation of genes encoding differentiation markers. *adjusted p value = 0.01. **adjusted p value < 0.005.
Figure 6
Figure 6
hGFAP-Cre/KrasG12D/p53fl/fl astrocytes show enhanced engraftment and more aggressive biology, compared to hGFAP-Cre/KrasG12D/p53fl/fl NSPC, in an orthotopic transplant assay. (A) 11/14 (78.6%) mice implanted with astrocytes developed clinical signs with engrafted tumors, compared to 3/10 (30.0%) mice implanted with neural stem/progenitor cells (NSPC) (p = 0.035). (B) Kaplan-Meier survival curves show that the onset of signs (and hence survival) was delayed in mice that received transformed NSPC (p = 0.028). (C) The NSPC tumors (a–d) show less hemorrhage than the astrocyte-induced tumors (e–h).
Figure 7
Figure 7
Tumors that develop after orthotopic transplantation differ histopathologically and show differential protein expression depending on the cell of origin. (A) At low magnification, infiltrative tumors arising from mutant neural stem/progenitor cells (NSPC) injection (a–h) tend to expand the hemisphere into which they are injected (a). A higher magnification view of the NSPC-derived tumor shows a small-cell, spindled cytomorphology (b). Sox2 is expressed robustly in the NSPC tumor (c, brown reaction product), whereas nestin staining is relatively weak (d). Tumors derived from NSPC injections show focal, nuclear Olig2 expression (e), moderate glial fibrillary acidic protein (GFAP) expression (f) and cytoplasmic Tuj1 expression (g). Scattered mitoses are seen with immunohistochemistry for p-H3 (h). Tumors derived from implanted astrocytes (i–p) are highly infiltrative also, often crossing the corpus callosum to the contralateral hemisphere and involving the ventricles (i, arrowhead marks hemorrhage, arrows indicate tumor in the lateral ventricles). Astrocyte tumors are characterized by a prominent giant cell phenotype (j). Sox2 expression is weaker than that seen in NSPC tumors (k), while the inverse pattern is seen with nestin (l). Olig2 is largely absent in the astrocyte neoplasm (m), and there is strong GFAP expression (n). Differentiation along neuronal lineages is not detected with Tuj1 in astrocyte tumors (o), which have a high mitotic rate (p). (B) Western blot confirms the immunofluorescent findings in the tumors and shows, in addition, strong Bmi-1 expression in both tumors and O4 expression exclusively in the NSPC tumor. (C) Mean mitoses per high-power field (HPF) is significantly greater in the astrocyte-derived neoplasms (p = 0.004, Student t-test).
Figure 8
Figure 8
In serum-containing medium, mutant astrocytes show a pattern of gene expression that parallels that reported for the mesenchymal subclass of human glioblastoma (GBM), including high CD44, CHI3/YKL-40, and vascular endothelial growth factor (VEGF) gene expression. Tumorigenic neural stem/progenitor cells (NSPCs), on the other hand, show a pattern reminiscent of the human proneural subclass, with high brevican (BCAN) and Tuj1 gene expression, compared to the tumors derived from mutant astrocytes. *p < 0.05; **p < 0.006.

References

    1. Coppola AR. Circumscribed "giant-cell" glioblastoma. Va Med Mon (1918) 1970;97:753–757. - PubMed
    1. Peraud A, Watanabe K, Schwechheimer K, et al. Genetic profile of the giant cell glioblastoma. Lab Invest. 1999;79:123–129. - PubMed
    1. Krouwer HG, Davis RL, Silver P, et al. Gemistocytic astrocytomas: a reappraisal. J Neurosurg. 1991;74:399–406. - PubMed
    1. Meis JM, Martz KL, Nelson JS. Mixed glioblastoma multiforme and sarcoma. A clinicopathologic study of 26 radiation therapy oncology group cases. Cancer. 1991;67:2342–2349. - PubMed
    1. Morantz RA, Feigin I, Ransohoff J., 3rd Clinical and pathological study of 24 cases of gliosarcoma. J Neurosurg. 1976;45:398–408. - PubMed

Publication types

MeSH terms

Substances