Clinical Trial
. 2012 Nov;42(11):3049-61.
doi: 10.1002/eji.201142361. Epub 2012 Aug 28.

Nano-particle vaccination combined with TLR-7 and -9 ligands triggers memory and effector CD8⁺ T-cell responses in melanoma patients

Affiliations
Free PMC article
Clinical Trial

Nano-particle vaccination combined with TLR-7 and -9 ligands triggers memory and effector CD8⁺ T-cell responses in melanoma patients

Simone M Goldinger et al. Eur J Immunol. 2012 Nov.
Free PMC article

Erratum in

  • Corrections.
    [No authors listed] [No authors listed] Eur J Immunol. 2016 Feb;46(2):493. doi: 10.1002/eji.201670027. Eur J Immunol. 2016. PMID: 26840199 Free PMC article. No abstract available.
  • Corrections.
    [No authors listed] [No authors listed] Eur J Immunol. 2016 Feb;46(2):493. doi: 10.1002/eji.201670026. Eur J Immunol. 2016. PMID: 26840200 Free PMC article. No abstract available.

Abstract

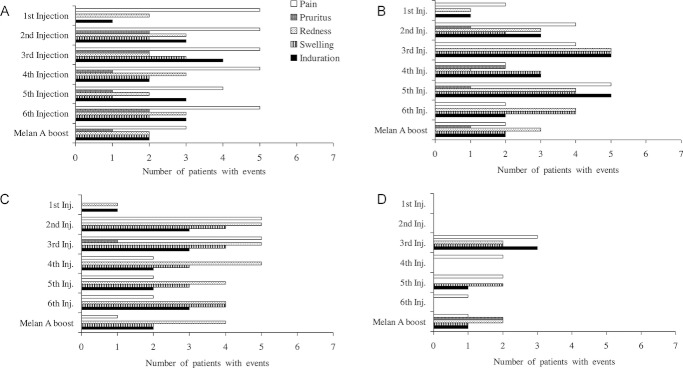
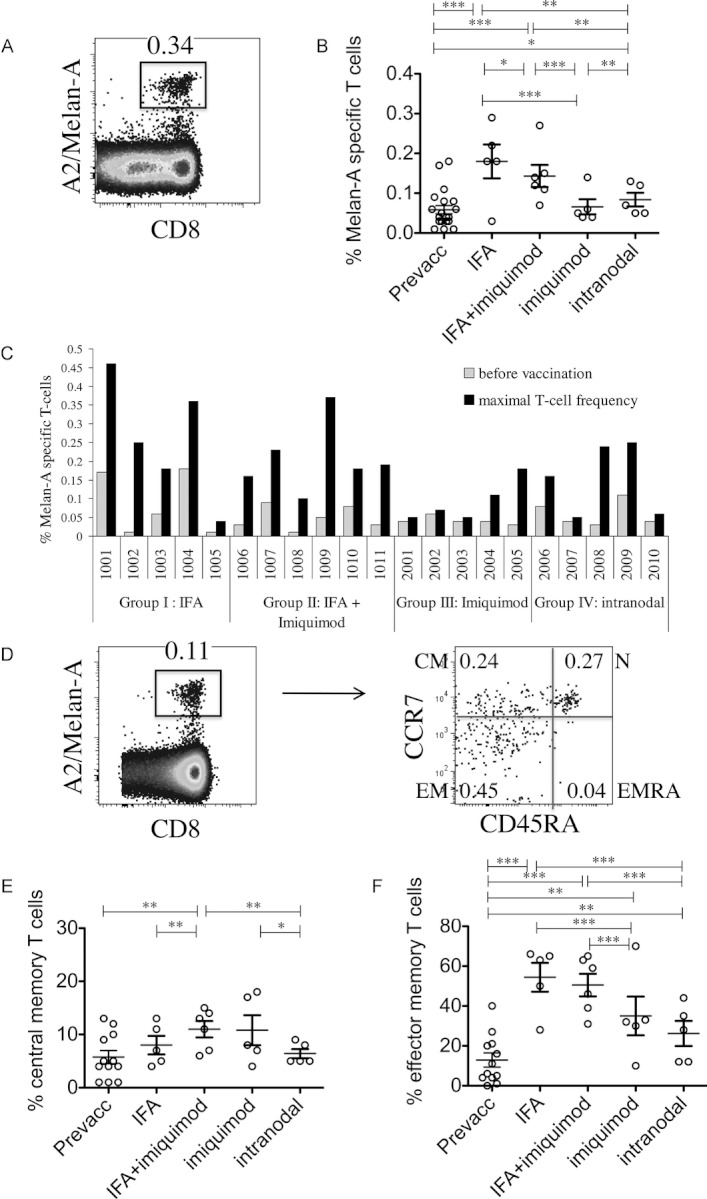
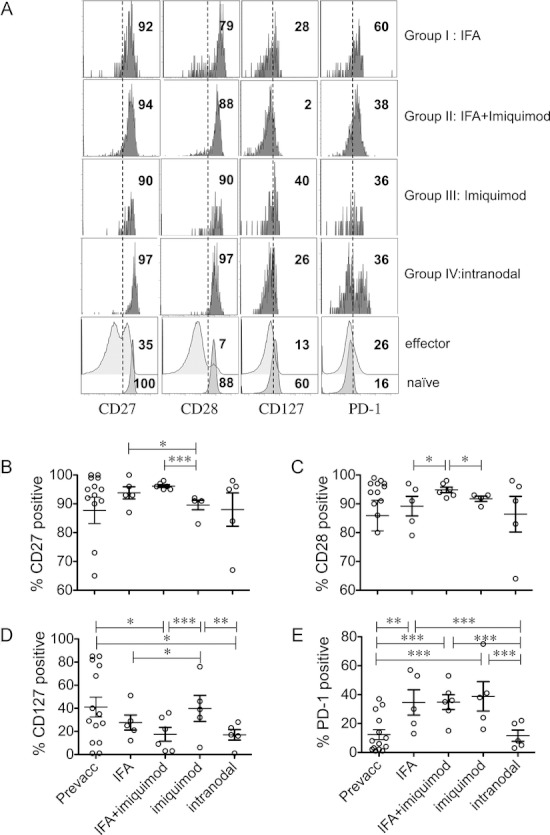
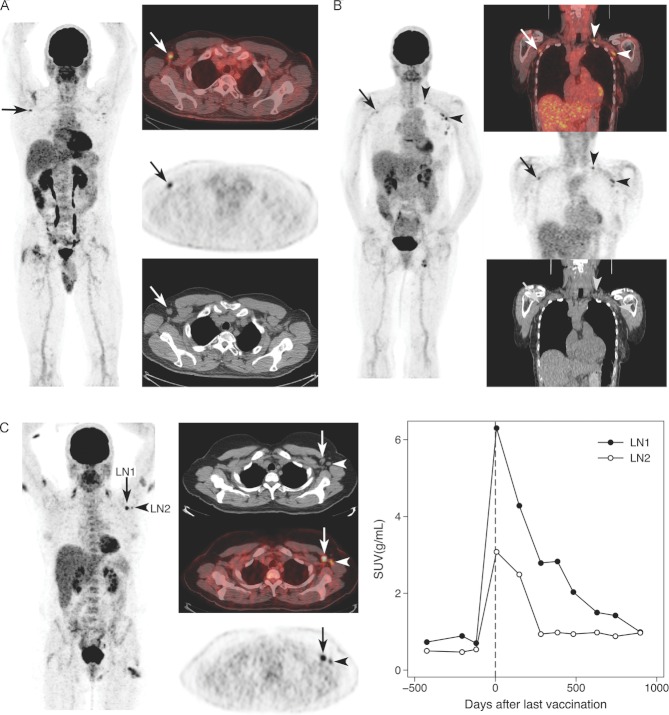
Optimal vaccine strategies must be identified for improving T-cell vaccination against infectious and malignant diseases. MelQbG10 is a virus-like nano-particle loaded with A-type CpG-oligonucleotides (CpG-ODN) and coupled to peptide(16-35) derived from Melan-A/MART-1. In this phase IIa clinical study, four groups of stage III-IV melanoma patients were vaccinated with MelQbG10, given (i) with IFA (Montanide) s.c.; (ii) with IFA s.c. and topical Imiquimod; (iii) i.d. with topical Imiquimod; or (iv) as intralymph node injection. In total, 16/21 (76%) patients generated ex vivo detectable Melan-A/MART-1-specific T-cell responses. T-cell frequencies were significantly higher when IFA was used as adjuvant, resulting in detectable T-cell responses in all (11/11) patients, with predominant generation of effector-memory-phenotype cells. In turn, Imiquimod induced higher proportions of central-memory-phenotype cells and increased percentages of CD127(+) (IL-7R) T cells. Direct injection of MelQbG10 into lymph nodes resulted in lower T-cell frequencies, associated with lower proportions of memory and effector-phenotype T cells. Swelling of vaccine site draining lymph nodes, and increased glucose uptake at PET/CT was observed in 13/15 (87%) of evaluable patients, reflecting vaccine triggered immune reactions in lymph nodes. We conclude that the simultaneous use of both Imiquimod and CpG-ODN induced combined memory and effector CD8(+) T-cell responses.


Figures

Figure 1
Figure 1
Incidence of injection site reactions per treatment group. The number of patients with pain and/or itching and the number of patients with a diameter ≥ 1 cm with regard to local erythema, swelling, and/or induration were enumerated in the available diary recordings. The results are shown for each injection. (A) Group I: local reactions after 1 mg s.c injection of MelQbG10 with IFA (n = 5) and (B) Group II: with IFA and topical Imiquimod 5% (n = 6); (C) Group III: i.d. injection with topical Imiquimod 5% (n = 5); and (D) Group IV: after ultrasound-guided intralymph node injection (14/42/140 μg MelQbG10, n = 5).
Figure 2
Figure 2
Frequency and memory-/effector-phenotype cell differentiation of Melan-A/MART-1-specific T cells. PBMCs were analyzed by flow cytometry directly ex vivo, that is without prior in vitro cultures. (A) Representative dot plot from one patient out of 21 (patient 1001-group I), showing staining for CD8 expression and Melan-A/HLA-A2 tetramers. (B) T-cell frequencies of the four patient groups, before (Prevacc) and after vaccination s.c. adjuvanted with IFA (group I, five patients), IFA with topical Imiquimod 5% (group II, six patients), i.d. injection with topical Imiquimod 5% (group III, five patients) or intranodal injection (group IV, five patients). (C) T-cell frequencies for each patient, before vaccination and the highest level reached after start of vaccination. (D) Representative dot plot from one patient of 21 (patient 1009, group II) of gating of Melan-A-specific T cells and staining with CCR7 and CD45RA-specific antibodies. (E) Percentages of central-memory (CM; CCR7+/CD45RA) phenotype cells among Melan-A-specific T cells of the four treatment groups. (F) Percentages of effector-memory (EM; CCR7/CD45RA) phenotype cells (n = 5 for patient groups I, III, IV, and n = 6 for patient group II). (A and D) Values indicate percentages of CD8+ T cells and of Melan-A-specific T cells. (B, E, and F) Data shown are mean values per patient, calculated from the results obtained with blood samples from all studied six time points after vaccination, as detailed in the Supporting Information Fig. 1. ***p<0.001, **p = 0.001–0.01, and *p = 0.011–0.049, Mann–Whitney test.
Figure 3
Figure 3
Expression of surface receptors by Melan-A/MART-1-specific T cells. Melan-A-specific T cells were gated similarly as in Figure 2, and analyzed for expression of the costimulatory molecules CD27 and CD28, the IL-7 receptor CD127 and the inhibitory receptor PD-1. (A) Representative dot plot from one patient out of n = 5–6 for each treatment group, that is patient 1001 (group I), patient 1009 (group II), patient 2002 (group III), and patient 2006 (group IV). As a reference, histograms in the lowest row show naïve (CCR7+/CD45RA+/tetramer) and effector (CCR7/CD45RA+/tetramer) phenotype cells, that is subsets of “antigen-nonspecific” CD8+ T cells from the representative patient 1009. Values in histograms indicate percent positive cells. (B–E) Statistical comparisons between the four treatment groups for expression of (B) CD27, (C) CD28, (D) CD127, and (E) PD-1 by Melan-A-specific T cells. The data shown in panel B–E are mean values per patient, calculated from the results obtained from all studied time points after vaccination, similarly as for Figure 2. *** <0.001, ** 0.001–0.01, and * 0.011–0.049, Mann–Whitney test.
Figure 4
Figure 4
PET/CT imaging showing enlarged lymph nodes and increased glucose metabolism after vaccination. Fifteen of the 21 patients of this study underwent PET/CT imaging. In parallel to the assessment of disease development (not shown), immune activation was evaluated by measuring the glucose metabolism in vaccine-site draining lymph nodes. (A) Patient 2002 (group III) with bilateral axillary lymph nodes with one that is enlarged (arrow). Images: Maximal intensity projection (left) with PET/CT fusion image (top), PET image (middle), and CT image (bottom). (B) Patient 2004 (group III) with multiple bilateral axillary (arrow, horizontal arrowhead) and subclavicular (vertical arrowhead) lymph nodes with increased glucose metabolism. (C) Patient 1003 (group I) with long-term longitudinal follow-up before and after the seven vaccinations injected between the third and fourth PET/CT studies. The standardized uptake value (SUV) was measured in two axillary lymph nodes (LN1, LN2) from patient 1003 (group I) before and after the last vaccination (right). Note also the local inflammation in vaccination sites in the proximal right and left arms and left thigh (left).
Figure 5
Figure 5
Reduced HLA-class I and Melan-A/MART-1 expression after vaccination. Immunohistochemistry images (×8 magnification) of different tumor biopsies before (left) and after (right) vaccination showing reduced Melan-A or HLA-class I expression. (A) Tumor biopsies from plantar left (primary tumor, left) and left leg (in transit cutaneous metastasis, right) with high (left) and low (right) Melan-A intensity staining (Patient 2010, group IV). (B) Biopsies of two dermal abdominal metastases, with high (left) and low (right) Melan-A intensity staining (Patient 2001, group III). (C) Cutaneous metastasis of the right knee (right and left) with low HLA-class I intensity staining (Patient 1003, group I). (D) Melan-A and HLA-class I expression before and after vaccination, for each evaluable patient (n = 8) are shown.

References

    1. Dudley ME, Yang JC, Sherry R, Hughes MS, Royal R, Kammula U, Robbins PF, et al. Adoptive cell therapy for patients with metastatic melanoma: evaluation of intensive myeloablative chemoradiation preparative regimens. J. Clin. Oncol. 2008;26:5233–5239. - PMC - PubMed
    1. Hodi FS, O'Day SJ, McDermott DF, Weber RW, Sosman JA, Haanen JB, Gonzalez R, et al. Improved survival with ipilimumab in patients with metastatic melanoma. N. Engl. J. Med. 2011;363:711–723. - PMC - PubMed
    1. Robert C, Thomas L, Bondarenko I, O'Day S, M DJ, Garbe C, Lebbe C, Baurain JF, et al. Ipilimumab plus dacarbazine for previously untreated metastatic melanoma. N. Engl. J. Med. 2011;364:2517–26. - PubMed
    1. Rosenberg SA, Yang JC, Restifo NP. Cancer immunotherapy: moving beyond current vaccines. Nat. Med. 2004;10:909–915. - PMC - PubMed
    1. Eggermont AM. Immunotherapy: vaccine trials in melanoma – time for reflection. Nat. Rev. Clin. Oncol. 2009;6:256–258. - PubMed

Publication types

MeSH terms