

Dual inhibition of canonical and noncanonical NF-κB pathways demonstrates significant antitumor activities in multiple myeloma
- PMID: 22806876
- PMCID: PMC4456190
- DOI: 10.1158/1078-0432.CCR-12-0779
Dual inhibition of canonical and noncanonical NF-κB pathways demonstrates significant antitumor activities in multiple myeloma
Erratum in
-
Correction: Dual Inhibition of Canonical and Noncanonical NF-κB Pathways Demonstrates Significant Antitumor Activities in Multiple Myeloma.Clin Cancer Res. 2019 May 1;25(9):2938. doi: 10.1158/1078-0432.CCR-19-0959. Clin Cancer Res. 2019. PMID: 31043386 No abstract available.
Abstract
Purpose: NF-κB transcription factor plays a key role in the pathogenesis of multiple myeloma in the context of the bone marrow microenvironment. Both canonical and noncanonical pathways contribute to total NF-κB activity. Recent studies have shown a critical role for the noncanonical pathway: selective inhibitors of the canonical pathway present a limited activity, mutations of the noncanonical pathway are frequent, and bortezomib-induced cytotoxicity cannot be fully attributed to inhibition of canonical NF-κB activity.
Experimental design: Multiple myeloma cell lines, primary patient cells, and the human multiple myeloma xenograft murine model were used to examine the biologic impact of dual inhibition of both canonical and noncanonical NF-κB pathways.
Results: We show that PBS-1086 induces potent cytotoxicity in multiple myeloma cells but not in peripheral blood mononuclear cells. PBS-1086 overcomes the proliferative and antiapoptotic effects of the bone marrow milieu, associated with inhibition of NF-κB activity. Moreover, PBS-1086 strongly enhances the cytotoxicity of bortezomib in bortezomib-resistant multiple myeloma cell lines and patient multiple myeloma cells. PBS-1086 also inhibits osteoclastogenesis through an inhibition of RANK ligand (RANKL)-induced NF-κB activation. Finally, in a xenograft model of human multiple myeloma in the bone marrow milieu, PBS-1086 shows significant in vivo anti-multiple myeloma activity and prolongs host survival, associated with apoptosis and inhibition of both NF-κB pathways in tumor cells.
Conclusions: Our data show that PBS-1086 is a promising dual inhibitor of the canonical and noncanonical NF-κB pathways. Our preclinical study therefore provides the framework for clinical evaluation of PBS-1086 in combination with bortezomib for the treatment of multiple myeloma and related bone lesions.
©2012 AACR.
Figures
 ), p50 (
 ), and c-Rel (
 ); NF-κB non-canonical activity included p52 (
 ) and RelB (
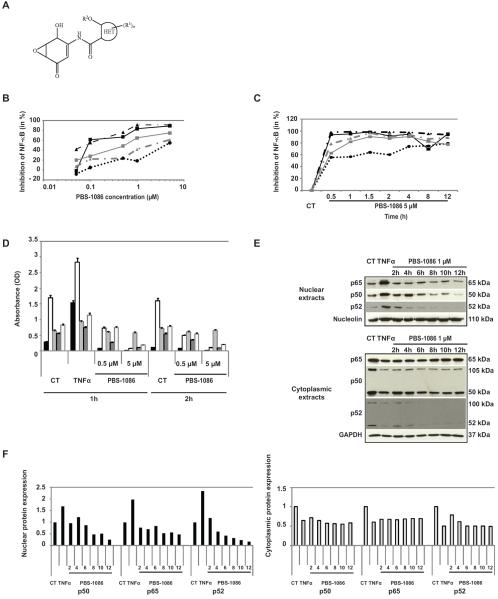
 ). (C) MM.1S cells were cultured with PBS-1086 (5 μM) at the indicated times (0.5 to 12 hours). NF-κB DNA binding activity in MM.1S nuclear extracts was measured by ELISA. NF-κB canonical activity included p65 (
 ), p50 (
 ), and c-Rel (
 ); NF-κB non-canonical activity included p52 (
 ) and RelB (
 ). Results are expressed as percent inhibition from the quantity of NF-κB protein bound in the PBS-1086 treated relative to the maximum quantity bound in the control. ELISA data shown are representative of three independent experiments. (D) MM.1S cells were treated with PBS-1086 (0.5 and 5 μM) for the indicated times (1 and 2 hours). NF-κB DNA binding activity in MM.1S nuclear extracts was measured by ELISA. NF-κB canonical activity included p65 (
 ), p50 (
 ), and c-Rel (
 ); NF-κB non-canonical activity included p52 (
 ) and RelB (
 ). Treatment with TNF-α (10 ng/ml) for 1 hour served as a positive control of NF-κB activity for both time points, 1 and 2 hours. The results of ELISA are expressed as relative absorbance. Data represent mean +/− SD of three independent experiments. (E) MM.1S cells were cultured with PBS-1086 (1 μM) for the indicated times (2 to 12 hours). Treatment with TNF-α (10 ng/ml) for 1 hour served as a positive control of increased p65, p50, and p52 nuclear translocation. Nuclear and cytoplasmic extracts were subjected to Western blotting using p50, p52, p65, GAPDH, and Nucleolin antibodies. GAPDH and Nucleolin were used as purity and loading controls for cytoplasmic and nuclear extracts, respectively. Blots are representative of three independent experiments. (F) The densitometric analysis of scanned immunoblotting images was performed with the NIH image J Software. Results of nuclear (
 ) (left panel) and cytoplasmic (
 ) (right panel) protein expression are expressed as fold change relative to control.
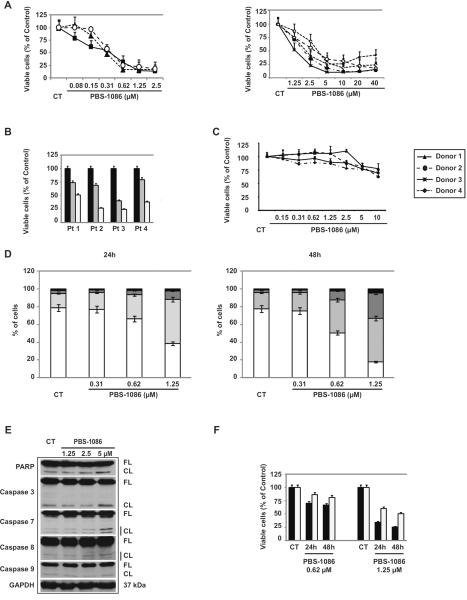
 ), INA6 (
 ), and KMS18 (
 ) were cultured with PBS-1086 (0.08–2.5 μM) for 48 hours (left panel). MM cell lines MM.1R (
 ), Dox40 (
 ), LR5 (
 ), RPMI 8226 (
 ), and U266 (
 ) were treated with PBS-1086 (1.25–40 μM) for 48 hours (right panel). (B) CD138+ MM cells from four patients were treated with PBS-1086 0 (
 ), 0.62 (
 ) and 1.25 μM (
 ) for 48 hours. (C) Mononuclear cells isolated from four healthy donors and stimulated by phytohemagglutinin were cultured with PBS-1086 (0.15–10 μM) for 48 hours. Cell viability was assessed by MTT assay of triplicate cultures, expressed as percentage of untreated control. Data represent mean +/− SD viability. (D) MM.1S cells were treated with PBS-1086 at the indicated doses (0.31 to 1.25 μM) for 24 and 48 hours. Apoptotic cells were analyzed by flow cytometry using Annexin V/PI staining. Percentages of viable (AV−/PI−) (
 ), early apoptotic (AV+/PI−) (
 ), late apoptotic (AV+/PI+) (
 ) and necrotic cells (AV−/PI+) (
 ) are shown as a histogram. Data represent mean +/− SD of three independent experiments. (E) MM.1S cells were cultured with PBS-1086 at the indicated doses (1.25 to 5 μM) for 24 hours. Whole cell lysates were subjected to Western blotting using anti-caspase 3, caspase 7, caspase 8, caspase 9, PARP and GAPDH antibodies. FL indicates full length, and CF denotes cleaved fragment. GAPDH was used as a loading control. Blots are representative of three independent experiments. (F) MM.1S cells were cultured with PBS-1086 (0.62 and 1.25 μM) for 24 and 48 hours in the presence (
 ) or absence (
 ) of z-VAD (20 μM). Cell viability was assessed by MTT assay of triplicate cultures, expressed as percentage of untreated control. Data represent mean +/− SD viability.
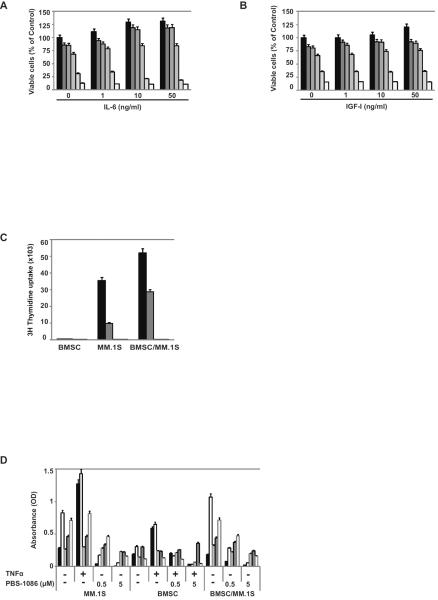
 ), 0.15 (
 ), 0.31 (
 ), 0.62 (
 ), 1.25 (
 ), and 2.5 μM (
 ), in the absence or presence of IL-6 (1, 10 and 50 ng/ml). (B) MM.1S cells were cultured for 48 hours with PBS-1086 0 (
 ), 0.15 (
 ), 0.31 (
 ), 0.62 (
 ), 1.25 (
 ), and 2.5 μM (
 ), in the absence or presence of IGF-I (1, 10 and 50 ng/ml). Cell viability was assessed by MTT assay of triplicate cultures, expressed as percentage of untreated control. Data represent mean +/− SD viability. (C) MM.1S cells were treated for 48 hours with PBS-1086 0 (
 ), 0.62 (
 ), 1.25 (
 ), and 2.5 μM (
 ), in the presence or absence of BMSCs. Cell viability was assessed by thymidine uptake of quadruplicate cultures, expressed as percentage of untreated control. Data represent mean +/− SD viability. (D) MM.1S cells were treated for 2 hours with PBS-1086 (0.5 and 5 μM), in the presence or absence of BMSCs. NF-κB DNA binding activity in MM.1S +/− BMSCs nuclear extracts was measured by ELISA. NF-κB canonical activity included p65 (
 ), p50 (
 ), c-Rel (
 ); NF-κB non-canonical activity included p52 (
 ) and RelB (
 ). Treatment with TNF-α (10 ng/ml) for 2 hours served as a positive control of NF-κB activation in MM.1S cells. The results of ELISA were expressed as relative absorbance. Data represent mean +/− SD of three independent experiments.
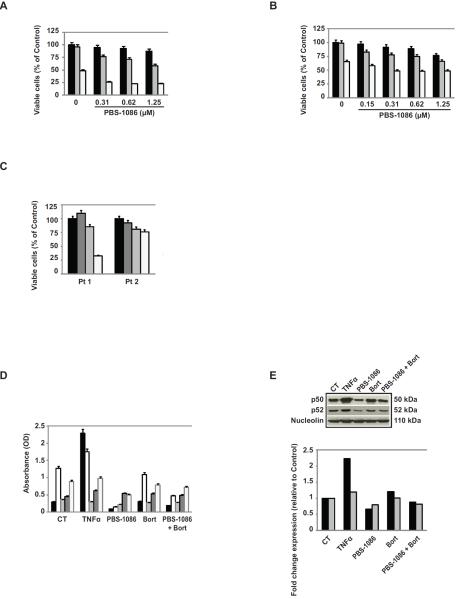
 ), 10 (
 ) and 15 nM (
 ), in the presence or absence of PBS-1086 (0.31–1.25 μM). (B) ANBL6-VR5 cells were cultured for 48 hours with bortezomib (Bort) 0 (
 ), 10 (
 ) and 20 nM (
 ), in the presence or absence of PBS-1086 (0.15–1.25 μM). Cell viability was assessed by MTT assay of triplicate cultures, expressed as percentage of untreated control. Data represent mean +/− SD viability. (C) CD138+ MM cells from two patients with bortezomib-resistant MM (Pt1 and Pt2) were treated with bortezomib (Bort) 10 nM (
 ) alone, PBS-1086 (1.25 μM) (
 ) alone, PBS-1086+Bort (
 ), or not treated (
 ) for 48 hours. Cell viability was assessed by MTT assay of triplicate cultures, expressed as percentage of untreated control. Data represent mean +/− SD viability. (D) ANBL6-VR5 cells were treated for 2 hours with PBS-1086 (1 μM), in the presence or absence of bortezomib (40 nM). NF-κB canonical activity included p65 (
 ), p50 (
 ), c-Rel (
 ); NF-κB non-canonical activity included p52 (
 ) and RelB (
 ). Treatment with TNF-α (10 ng/ml) for 2 hours served as a positive control of NF-κB activation in ANBL6-VR5 cells. The results of ELISA were expressed as relative absorbance. Data represent mean +/− SD of three independent experiments. (E) Corresponding nuclear extracts from ANBL6-VR5 cells treated for 2 hours with PBS-1086 (1 μM) +/− bortezomib (40 nM) were subjected to Western blotting using p50, p52, and Nucleolin antibodies. Blots are representative of three independent experiments. The densitometric analysis of scanned immunoblotting images for p50 (
 ) and p52 (
 ) was performed with the NIH image J Software and expressed as fold change relative to non-treated cells.
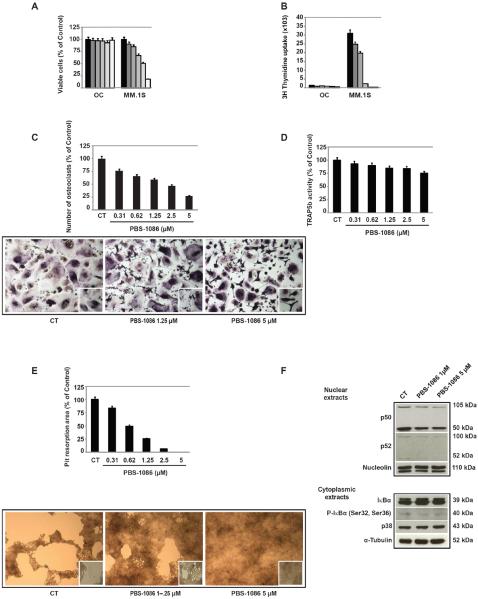
 ), 0.31 (
 ), 0.62 (
 ), 1.25 (
 ), 2.5 (
 ), and 5 μM (
 ). Cell viability was assessed by MTT assay of triplicate cultures, expressed as percentage of untreated control. Data represent mean +/− SD viability. (B) Cell viability was assessed by thymidine uptake of quadruplicate cultures, expressed as percentage of untreated control. Data represent mean +/− SD viability. (C) Mature osteoclasts (OC) were treated for 48 hours with PBS-1086 (0.31-5 μM). Cells were stained for TRAP activity. Cell density was equal in all samples. TRAP positive multinucleated osteoclasts after PBS-1086 treatment are quantitated as percentage of untreated control. For non-treated control as well as PBS-1086 1.25 and 5 μM treated cultures, the corresponding micrographs are shown (10×), with inserts at higher magnification. Data represent mean +/− SD counts of three independent experiments. (D) Mature osteoclasts (OC) were treated for 48 hours with PBS-1086 (0.31-5 μM). The presence of TRAP5b in the supernatants of culture was quantified by ELISA, expressed as percentage of untreated control. Data represent mean +/− SD absorbance of triplicate experiments. (E) Primary human osteoclast precursors derived from two MM patients were seeded on calcium phosphate-coated plates. Cells were treated with PBS-1086 (0.31-5 μM) in the presence of M-CSF (25 ng/ml) and RANKL (50 ng/ml) to mature osteoclasts. Osteoclasts not stimulated with M-SCF nor RANKL served as a negative control and failed to resorb. Osteoclasts stimulated with M-CSF and RANKL (positive control) resorbed calcium phosphate (>95%). The average pit resorption area with PBS-1086 was expressed as percentage of positive control. For non-treated control, as well as PBS-1086 1.25 and 5 μM treated cultures, the corresponding micrographs are shown (10×), with inserts at higher magnification. Data represent mean +/− SD of four independent experiments. (F) Nuclear and cytoplasmic extracts from mature osteoclasts were cultured for 2 hours with PBS-1086 at 1 and 5 μM. Control non-treated osteoclasts were only stimulated with RANKL and M-CSF. Nuclear extracts were subjected to Western blotting using p50, p52, and Nucleolin antibodies. Cytoplasmic extracts were subjected to Western blotting using IκBα, P-IκBα (Ser 32/36), p38, and α-Tubulin antibodies. Nucleolin and α-Tubulin were used as purity and loading controls for nuclear and cytoplasmic extracts, respectively. Blots are representative of three independent experiments.
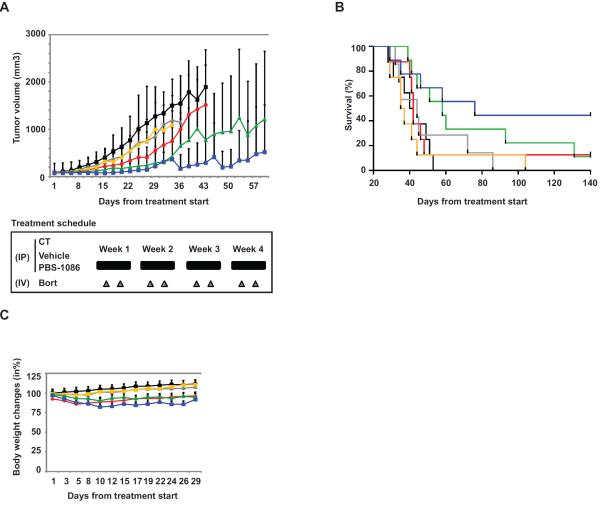
 ) (n=8); 0.5 mg/kg bortezomib IV twice a week for 4 weeks (
 ) (n=8); PBS-1086 at 2.5 mg/kg IP and bortezomib IV (
 ) (n=9); or PBS-1086 at 7.5 mg/kg IP and bortezomib IV (
 ) (n=9). A vehicle control group (
 ) (n=8) received IP injections of vehicle alone daily for 4 weeks. The non-treated control (CT) group (
 ) (n=8) received IP injections of saline daily for 4 weeks. Tumor volume was calculated from caliper measurements three times per week, and error bars represent +/− SE. Tumor volume curve extends to 57 days from the first day of treatment, when half of the mice per group have died. (B) Survival was evaluated from the first day of treatment using Kaplan-Meier curves. (C) Body weight of mice treated with PBS-1086, bortezomib (Bort), PBS-1086+bortezomib (PBS-1086+Bort), vehicle (Veh) or control (CT) was expressed as percentage of baseline. Body weight curve extends to 29 days from the first day of treatment, when the death in any of the groups was first observed. Error bars represent +/− SD body weight.
References
-
- Roodman GD. Pathogenesis of myeloma bone disease. Leukemia. 2009;23(3):435–41. - PubMed
-
- Richardson PG, Barlogie B, Berenson J, Singhal S, Jagannath S, Irwin D, et al. A phase 2 study of bortezomib in relapsed, refractory myeloma. N Engl J Med. 2003;348(26):2609–17. - PubMed
-
- Laubach J, Richardson P, Anderson K. Multiple myeloma. Annu Rev Med. 2011;62:249–64. - PubMed
-
- Hideshima T, Anderson KC. Molecular mechanisms of novel therapeutic approaches for multiple myeloma. Nat Rev Cancer. 2002;2(12):927–37. - PubMed
-
- Gilmore TD. Multiple myeloma: lusting for NF-kappaB. Cancer Cell. 2007;12(2):95–7. - PubMed
MeSH terms
Substances
Grants and funding
LinkOut - more resources
Full Text Sources
Other Literature Sources
Medical
