. 2012 Dec;61(12):3094-105.
doi: 10.2337/db12-0072. Epub 2012 Jul 17.

GSH or palmitate preserves mitochondrial energetic/redox balance, preventing mechanical dysfunction in metabolically challenged myocytes/hearts from type 2 diabetic mice

Affiliations

GSH or palmitate preserves mitochondrial energetic/redox balance, preventing mechanical dysfunction in metabolically challenged myocytes/hearts from type 2 diabetic mice

Carlo G Tocchetti et al. Diabetes. 2012 Dec.

Abstract

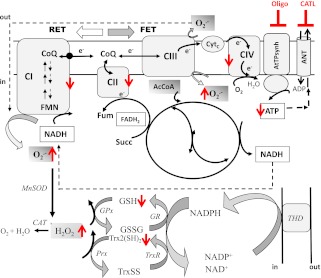
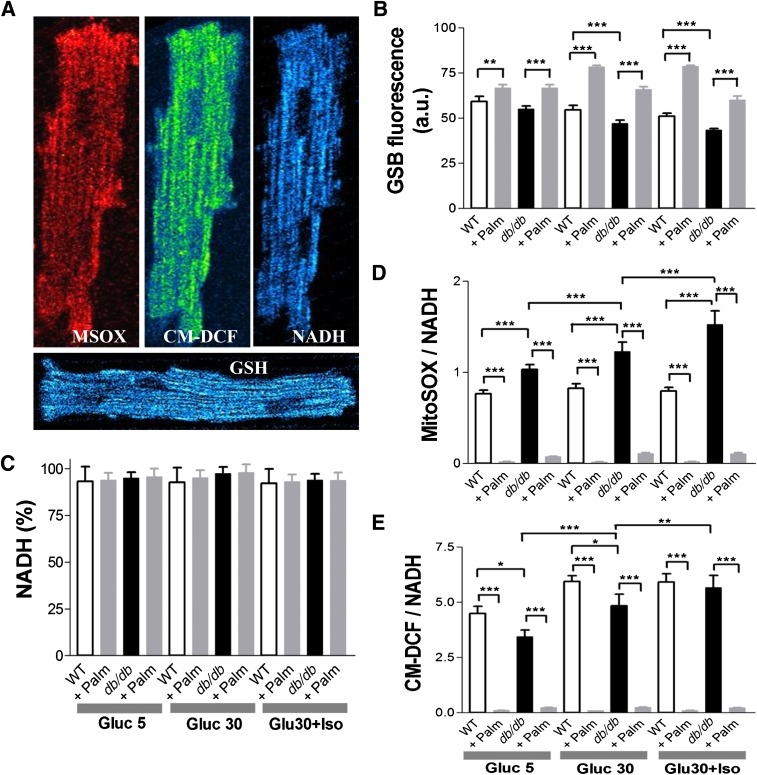
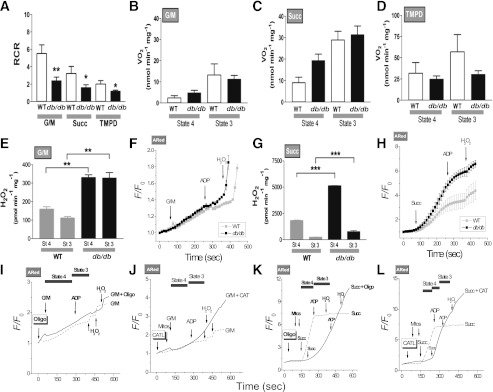
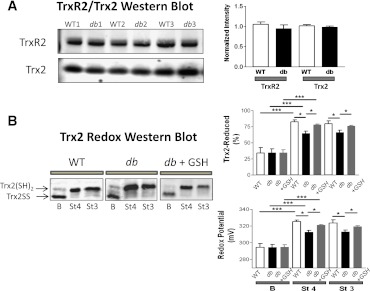
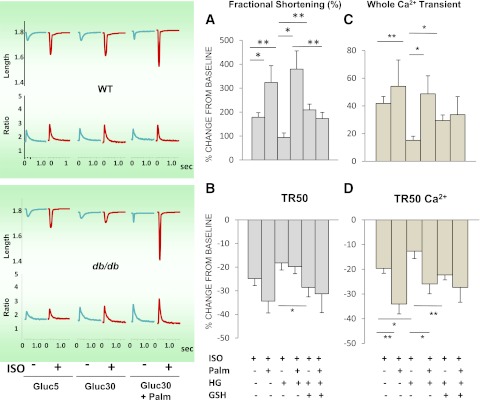
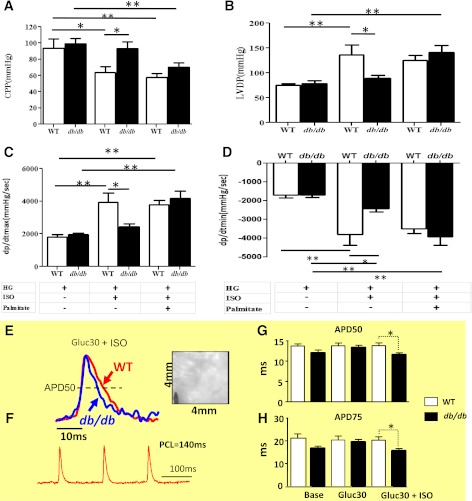
In type 2 diabetes, hyperglycemia and increased sympathetic drive may alter mitochondria energetic/redox properties, decreasing the organelle's functionality. These perturbations may prompt or sustain basal low-cardiac performance and limited exercise capacity. Yet the precise steps involved in this mitochondrial failure remain elusive. Here, we have identified dysfunctional mitochondrial respiration with substrates of complex I, II, and IV and lowered thioredoxin-2/glutathione (GSH) pools as the main processes accounting for impaired state 4→3 energetic transition shown by mitochondria from hearts of type 2 diabetic db/db mice upon challenge with high glucose (HG) and the β-agonist isoproterenol (ISO). By mimicking clinically relevant conditions in type 2 diabetic patients, this regimen triggers a major overflow of reactive oxygen species (ROS) from mitochondria that directly perturbs cardiac electro-contraction coupling, ultimately leading to heart dysfunction. Exogenous GSH or, even more so, the fatty acid palmitate rescues basal and β-stimulated function in db/db myocyte/heart preparations exposed to HG/ISO. This occurs because both interventions provide the reducing equivalents necessary to counter mitochondrial ROS outburst and energetic failure. Thus, in the presence of poor glycemic control, the diabetic patient's inability to cope with increased cardiac work demand largely stems from mitochondrial redox/energetic disarrangements that mutually influence each other, leading to myocyte or whole-heart mechanical dysfunction.


Figures

FIG. 1.
FIG. 1.
Major energetic and redox pathways in mitochondria. The scheme shows the respiratory complexes (I–IV), the ATP synthase (ATPsynth), and the ANT in the inner mitochondrial membrane. Also displayed are the major sites of superoxide (O2.−) production and its conversion to H2O2 by manganese superoxide dismutase (MnSOD), the tricarboxylic acid cycle, and the H2O2 scavenging pathways in the matrix. O2.− can be produced by complexes I and III (CI and CIII) of the electron transport chain through FET or RET, which depends on NADH- or FADH-linked substrates such as G/M or Succ, donating electrons to complex I or II, respectively. FET and RET, the two main modes of electron transport known, produce markedly different ROS overflow (RET→FET) (29). In RET, electrons flow from complex II to I instead of complex III, which occurs in mitochondria oxidizing high amounts of Succ, but FET is considered the physiological mode. The NADPH/NADP+ coupled with the highest (negative) redox potential (approximately −360 to −400 mV) is the main electron donor of the large-capacity GSH (GSSG) and the Trx (Trx[SH]2, TrxSS) systems responsible for scavenging H2O2 via GSH peroxidase (GPx) and peroxiredoxin (Prx) enzymes, respectively. Highlighted in red are the increased (↑: O2.−, H2O2, and TrxSS) or decreased (↓: ATP, GSH, and respiratory complex I, II, and IV) levels or activity found after two-photon microscopy imaging of intact cardiomyocytes, contractile measurements, and bioenergetic, redox, and ROS measurements in isolated mitochondria from db/db mice. Oligomycin (Oligo) or carboxyatractyloside (CATL) inhibits the ATP synthase or the ANT (indicated by blunted red bars), blocking the state 4→3 transition and mimicking the dysfunctional energetic-redox phenotype shown by db/db mice hearts (Fig. 3). AcCoA, acetyl-coenzyme A; CAT, catalase; CIV, respiratory complex IV; CoQ, coenzyme Q; Cytc, cytochrome c; FMN, flavin mononucleotide; Fum, fumarate; GR, glutathione reductase; THD, transhydrogenase.
FIG. 2.
FIG. 2.
Imaging of WT and db/db cardiomyocyte redox status under normal glucose or HG without or with β-adrenergic stimulation and in the absence or presence of Palm. ROS levels were monitored with the probes 5-(6)-chloromethyl-2, 7-dichlorohydrofluorescein diacetate (CM-H2DCFDA), MitoSOX (MSOX), and reduced GSH with GSH S-bimane (GSB) (31) (all from Invitrogen, Eugene, OR). A: Freshly isolated murine cardiomyocytes were loaded with MitoSOX (2 μmol/L, left panel) and CM-H2DCFDA (2 μmol/L, middle panel) and imaged with two-photon laser scanning fluorescence microscopy. B: GSH was imaged in myocytes loaded with the membrane-permeant indicator monochlorobimane (50 μmol/L, bottom panel), reporting the level of GSH as the fluorescent product GSB (31). C: NADPH autofluorescence was imaged simultaneously with the ROS probes and used for normalizing MitoSOX (D) and CM-H2DCFDA (E) signals. The NADPH signal was calibrated with 1 mmol/L potassium cyanide (KCN) (100% reduction) and 5 μmol/L carbonyl cyanide 4-(trifluoromethoxy)phenylhydrazone (FCCP) (0% reduction or maximal oxidation). Baseline imaging of cells was performed with Tyrode, pH 7.5, containing 1 mmol/L Ca2+ and normal (5 mmol/L) glucose, followed by the same solution with 30 mmol/L glucose (HG), in the absence or the presence of 10 nmol/L ISO (Gluc 30 + Iso). The same protocol was repeated in the presence of two Palm concentrations (0.4 or 0.8 mmol/L) for WT or db/db (Supplementary Fig. 1). Cardiomyocytes were incubated for 30 or 3 min under HG conditions without or with ISO, respectively. Depicted are the results obtained from paired determinations in two independent experiments with n = 30 for each treatment and fluorescent probe. For all fluorescent signals (GSB, MitoSOX, and CM-DCF), WT and db/db cardiomyocytes were compared by two-way ANOVA within treatment (e.g., 5 mmol/L glucose) for the absence (control) or presence of Palm. In addition, the normalized ROS signals over NADH (for which fluorescence did not change by treatments) were compared across treatments by two-way ANOVA when Palm was absent or present. *P < 0.05; **P < 0.01; ***P < 0.001. a.u., arbitrary units. (A high-quality digital representation of this figure is available in the online issue.)
FIG. 3.
FIG. 3.
Energetic and redox behavior of WT and db/db mouse mitochondria and blockade of the state 4→3 transition. Respiration in freshly isolated heart mitochondria from WT and db/db mouse was analyzed with a SeaHorse XF96 analyzer as described in research design and methods. AD: Mitochondria were assayed under state 4, i.e., substrate but no ADP (48) (sometimes also referred to as state 2) (49), and state 3, i.e., substrate and ADP present, respiration (Vo2) with substrates from complex I (5 mmol/L G/M) (B), complex II (5 mmol/L Succ and 1 μmol/L rotenone) (C), and complex IV (0.5 mmol/L N,N,N′,N′-tetramethyl-p-phenylenediamine [TMPD] and 3 mmol/L sodium ascorbate) (D). State 3 was induced with 1 mmol/L ADP in all cases. A: The RCR was determined as the ratio of state 3 to state 4. The bars plotted correspond to n = 8 replicates from two experiments. Respiratory rates determined in the current study belong to the medium to low range of those reported in the literature. Consequently, we further ascertained the quality of our mitochondrial preparation by assaying citrate synthase activity in WT and db/db mitochondrial extracts. The values found compare very well with previous reports (seeSupplementary Data). EH: H2O2 was monitored with the Amplex Red (ARed) assay. Shown are the results obtained with H2O2-specific fluxes (E and G) or H2O2 emission in state 4 or 3 respiration (F and H) under FET (5 mmol/L G/M) (E and F) and RET (5 mmol/L Succ) (G and H). NADH and ΔΨm were monitored simultaneously with a spectrofluorometer (Supplementary Fig. 2), and O2 measurements were performed in parallel under similar conditions (AD). Depicted are the normalized ARed traces obtained for WT and db/db mitochondria after G/M (F), Succ (H), and ADP addition, as indicated by arrows. H2O2 (50 nmol/L) was added for calibration purposes. The number of samples analyzed was n = 6 (two experiments) (E and G) and n = 4 (two experiments) (F and H). *P < 0.05; **P < 0.01; ***P < 0.001. Mitochondria from WT mouse heart were resuspended and analyzed under FET (I and J) and RET (K and L) conditions in a spectrofluorometer for H2O2 monitored with ARed or NADH as described in research design and methods. Mitochondria (50–100 μg mitochondrial protein) preincubated with 5 μmol/L oligomycin (Oligo) (I and K) or 10 μmol/L carboxyatractyloside (J and L) are indicated by a continuous line, and control mitochondria in the absence of inhibitors are indicated by a dashed line. Additions of substrate (5 mmol/L G/M or 5 mmol/L Succ), 1 mmol/L ADP, or 50 nmol/L H2O2 (for calibration) are indicated by arrows. Notice that after Oligo or CATL, H2O2 emission continues after ADP (marked) during the transition between states 4→3 of respiration, compared with controls.
FIG. 4.
FIG. 4.
Abundance, redox status, and response of Trx system from WT and db/db mitochondria to preincubation with GSHee. Freshly isolated heart mitochondria from WT and db/db mice were handled and analyzed for TrxR2 and Trx2 protein abundance by Western blot (WB) and for Trx-SS and Trx(SH)2 status by redox WB. A: Shown are three representative examples (left) and the statistical comparison between WT and db/db (n = 6 experiments) (right). As in Supplementary Fig. 3, protein was normalized to total protein abundance based on Direct Blue 71 staining. Trx(SH)2 and Trx-SS were determined in fresh, active mitochondria (150–200 μg mitochondrial protein), under baseline (nonenergized) (B), state 4 (St 4) (5 mmol/L G/M), and state 3 (St 3) (+1 mmol/L ADP) of respiration in paired samples as described elsewhere (33). B: Representative redox WB of Trx2 from WT and db/db mitochondria (left), and the amount of Trx(SH)2 (right) (top, in %) and redox potential (bottom, in mV) comparatively between WT and db/db mitochondria, in the absence or presence of GSHee preincubation (3 mmol/L GSHee for 30 min; n = 6 experiments). *P < 0.05; ***P < 0.001.
FIG. 5.
FIG. 5.
Contractile behavior of db/db cardiomyocytes under EG and hyperglycemia without or with β-adrenergic stimulation and GSHee or Palm preincubation. Cardiomyocytes from db/db mouse hearts were isolated, handled, and analyzed for cell shortening (A and C) and Ca2+ transients (B and D), in parallel with the imaging studies (Fig. 2). Left: Representative traces of the main experimental situations. EG and HG were used in the absence or presence of β-adrenergic stimulation with 10 nmol/L ISO and without or with preincubation in the presence of 4 mmol/L GSHee for 3 h or Palm (0.4 or 0.8 mmol/L for WT and db/db, respectively), at room temperature (Tables 1 and 2). The number of samples analyzed was n = 20–30 (from four to six hearts). T50% peak shortening, from baseline to 50% peak shortening; TR50, time to 50% relengthening; T50 Ca2+, time to 50% Ca2+ transient decay. *P < 0.05; **P < 0.01.
FIG. 6.
FIG. 6.
LV function in Langendorff-perfused hearts and high-resolution optical AP imaging. Hearts were harvested, handled, and perfused as described in research design and methods. Hearts were paced with a Radnoti pacing electrode (Monrovia, CA) at 600 bpm (10 Hz, 4-ms duration, 4 V) using a Grass stimulator (Grass Instruments Co., Quincy, MA). LV function was monitored with a water-filled, customized latex balloon connected to a P23XL pressure transducer with interface cable (Harvard Apparatus Instruments, Holliston, MA) and coupled to a BIOPAC System (DA100, Santa Barbara, CA) for continuous data recording and offline analysis. LV end-diastolic pressure was set at 5–10 mmHg by adjusting the balloon volume with a Gilmont micrometer syringe (Cole-Parmer, Vernon Hills, IL). After stabilization in KH buffer (11 mmol/L glucose; EG), the heart was exposed to ISO (10 nmol/L), followed by a drug-free perfusion period to recover baseline parameters. The same heart was perfused for 1 h with KH buffer containing 30 mmol/L glucose, followed by exposure to ISO again. Shown are (in mmHg) the CPP, LVDP, and (in mmHg/s) maximal rates of contraction (dP/dtmax) and relaxation (dP/dtmin) observed under HG (30 mmol/L glucose), in the absence or presence of ISO (10 nmol/L) and Palm (WT, 0.4 mmol/L; db/db, 0.8 mmol/L). The data presented correspond to n = 4 hearts in each group of WT or db/db. The same protocol was applied at Palm 0.2 mmol/L WT and 0.4 mmol/L db/db under EG and HG (n = 6 hearts from each group; see Supplementary Figs. 5–7). APD was measured in paced (140-ms pacing cycle length [PCL]) WT and db/db hearts during perfusion under baseline, HG, and HG + ISO. The CCD-based, high-resolution optical mapping system is capable of measuring APs from 6,400 pixels of the 4 × 4-mm2 epicardial surface with high temporal (1 ms) and spatial (50 μm) resolutions in intact murine hearts. Also measured were epicardial conduction velocity (CV) and normalized AP upstroke velocity under the same conditions (Supplementary Fig. 8). E and F: Representative epicardial APs measured from WT (red) and db/db (blue) mice during pacing at 140 ms PCL. Also shown is a CCD-based image of the mapped epicardial region with the pacing electrode in the lower left corner. G and H: The HG + ISO regimen uncovered a significant shortening of APD50 and APD75 in db/db but not WT hearts. *P < 0.05; **P < 0.01.

References

    1. Bell DSH. Heart failure: the frequent, forgotten, and often fatal complication of diabetes. Diabetes Care 2003;26:2433–2441 - PubMed
    1. Laakso M. Hyperglycemia and cardiovascular disease in type 2 diabetes. Diabetes 1999;48:937–942 - PubMed
    1. Boudina S, Abel ED. Diabetic cardiomyopathy, causes and effects. Rev Endocr Metab Disord 2010;11:31–39 - PMC - PubMed
    1. Cohen-Solal A, Beauvais F, Logeart D. Heart failure and diabetes mellitus: epidemiology and management of an alarming association. J Card Fail 2008;14:615–625 - PubMed
    1. Bruce DG, Chisholm DJ, Storlien LH, Kraegen EW, Smythe GA. The effects of sympathetic nervous system activation and psychological stress on glucose metabolism and blood pressure in subjects with type 2 (non-insulin-dependent) diabetes mellitus. Diabetologia 1992;35:835–843 - PubMed

Publication types