. 2013 Jun;69(6):1501-11.
doi: 10.1002/mrm.24399. Epub 2012 Jul 17.

Lipid suppression in CSI with spatial priors and highly undersampled peripheral k-space

Affiliations

Lipid suppression in CSI with spatial priors and highly undersampled peripheral k-space

Berkin Bilgic et al. Magn Reson Med. 2013 Jun.

Abstract

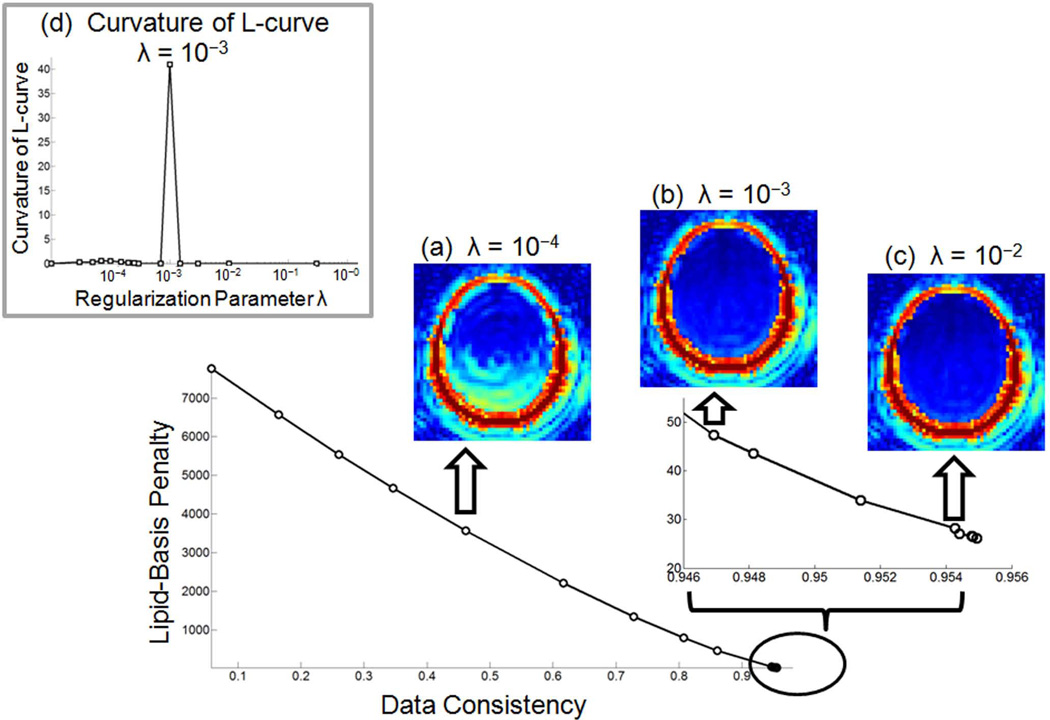
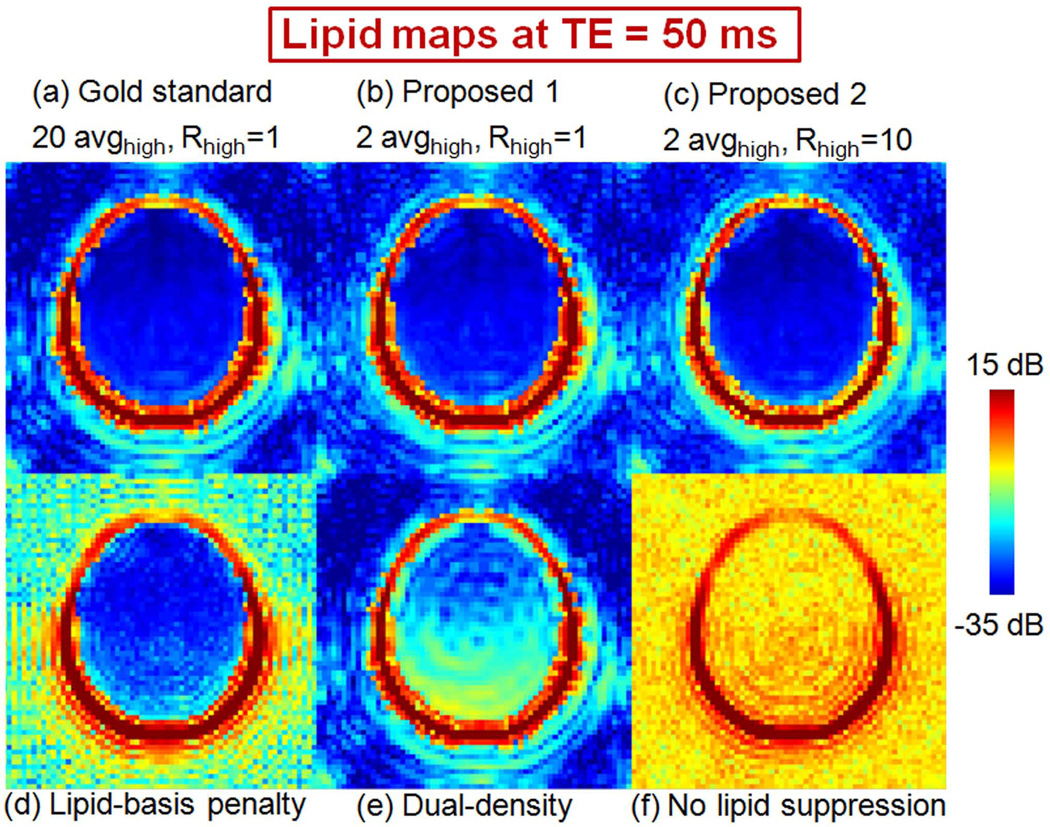
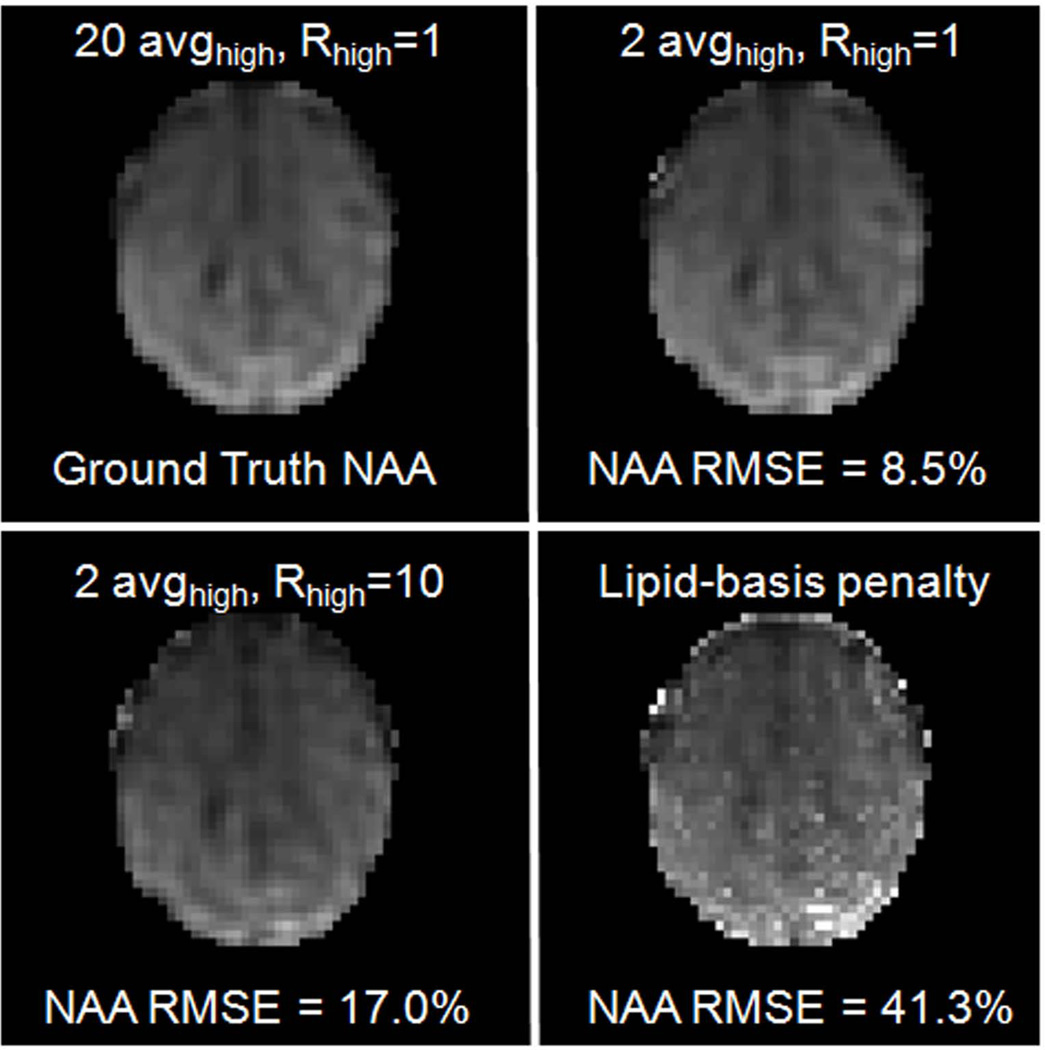
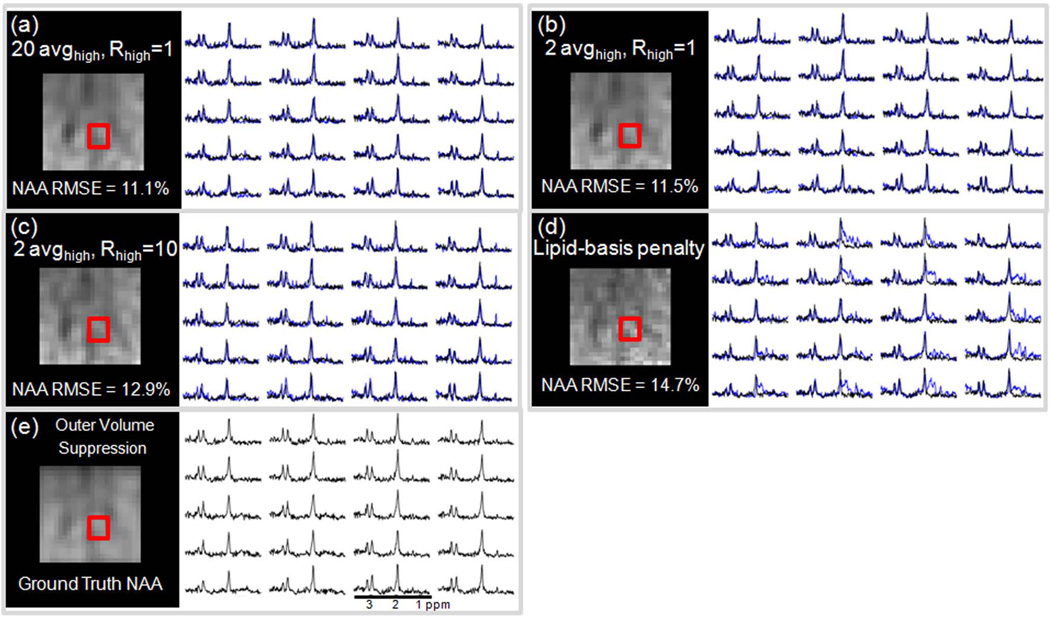
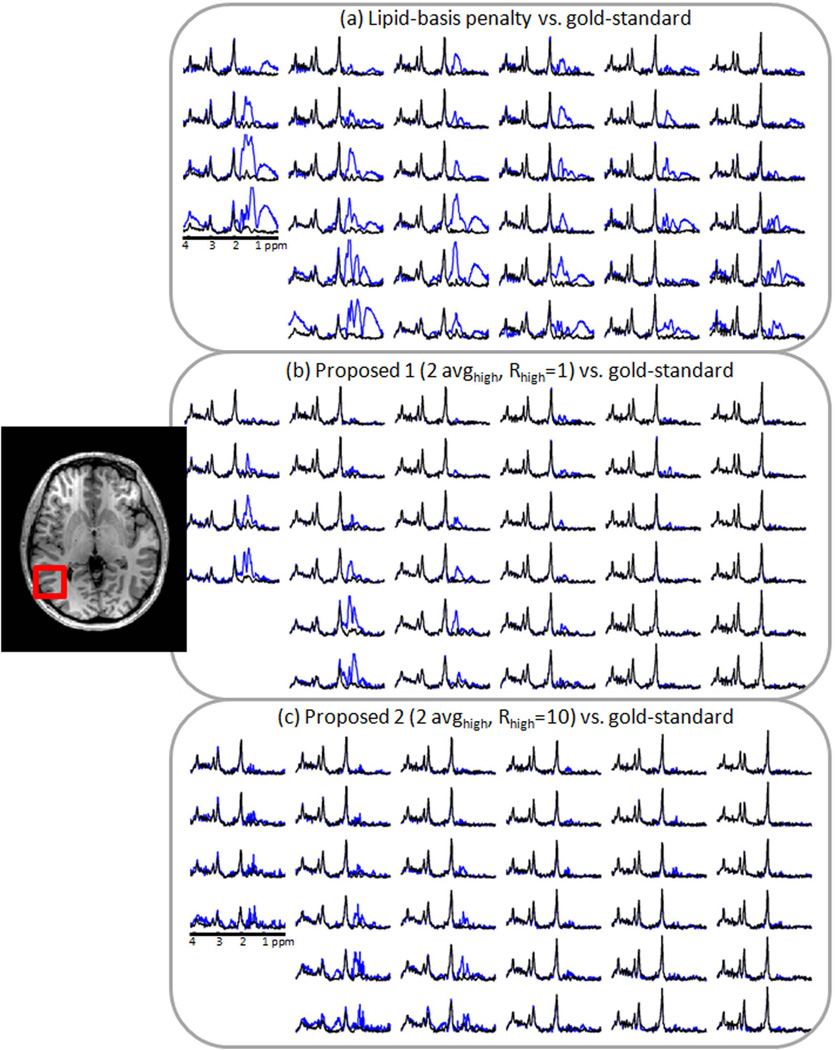
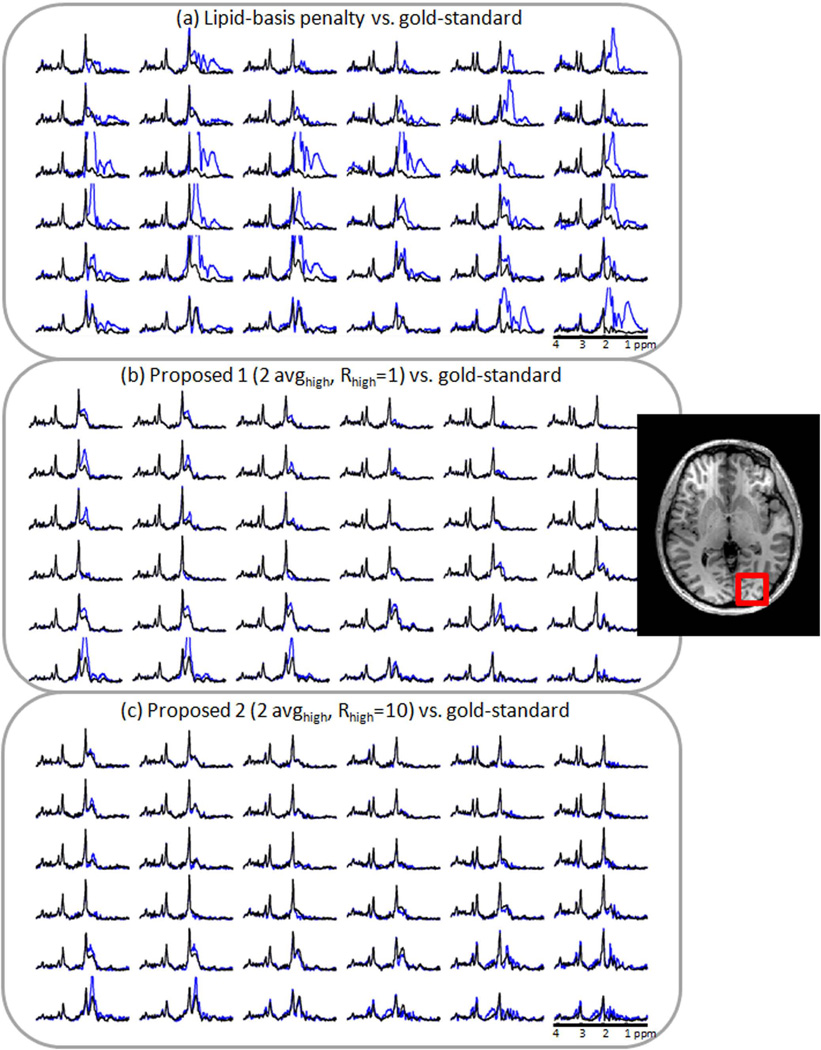
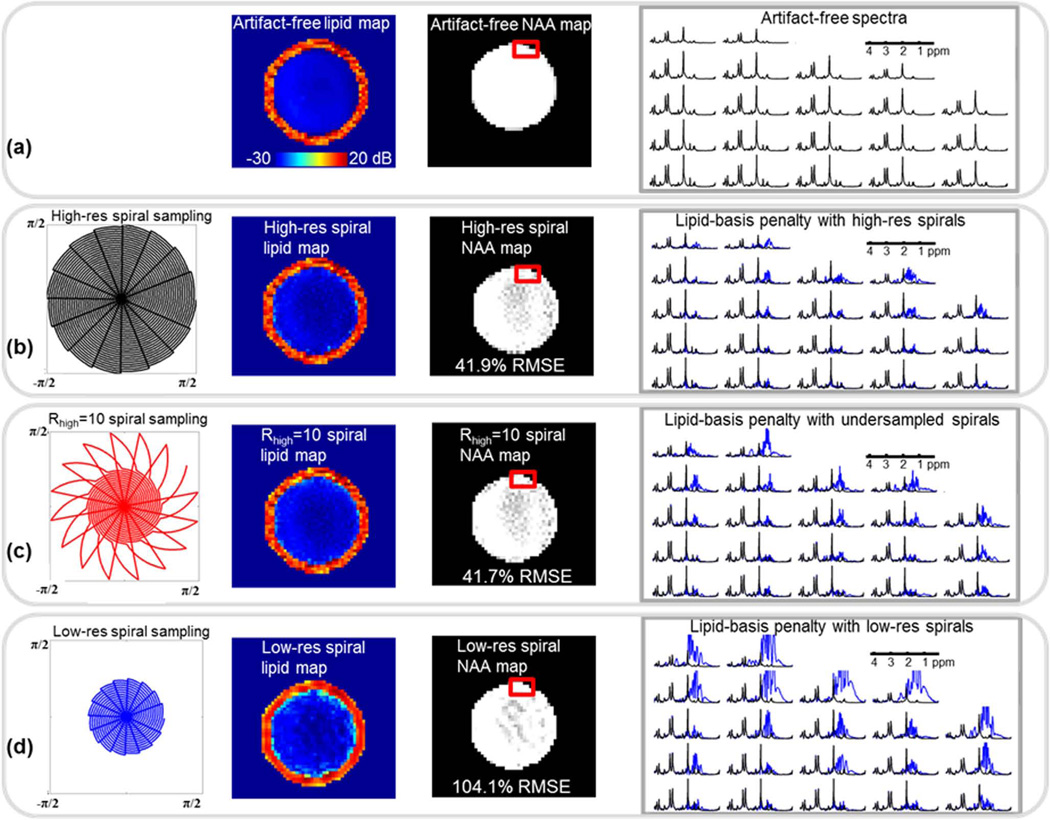
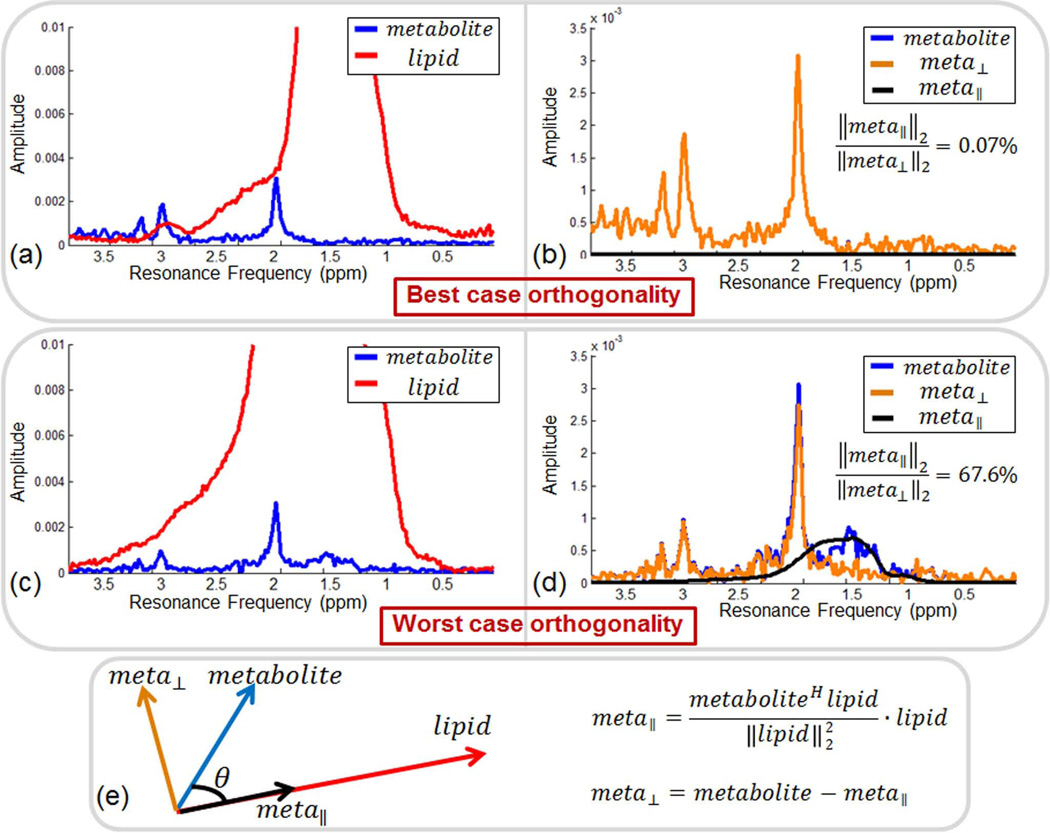
Mapping 1H brain metabolites using chemical shift imaging is hampered by the presence of subcutaneous lipid signals, which contaminate the metabolites by ringing due to limited spatial resolution. Even though chemical shift imaging at spatial resolution high enough to mitigate the lipid artifacts is infeasible due to signal-to-noise constraints on the metabolites, the lipid signals have orders of magnitude of higher concentration, which enables the collection of high-resolution lipid maps with adequate signal-to-noise. The previously proposed dual-density approach exploits this high signal-to-noise property of the lipid layer to suppress truncation artifacts using high-resolution lipid maps. Another recent approach for lipid suppression makes use of the fact that metabolite and lipid spectra are approximately orthogonal, and seeks sparse metabolite spectra when projected onto lipid-basis functions. This work combines and extends the dual-density approach and the lipid-basis penalty, while estimating the high-resolution lipid image from 2-average k-space data to incur minimal increase on the scan time. Further, we exploit the spectral-spatial sparsity of the lipid ring and propose to estimate it from substantially undersampled (acceleration R=10 in the peripheral k-space) 2-average in vivo data using compressed sensing and still obtain improved lipid suppression relative to using dual-density or lipid-basis penalty alone.


Figures

Fig. 1
Fig. 1
The L-curve traced by the data consistency and lipid-basis penalty terms as the regularization parameter λ varies. Summation over lipid frequencies for under-regularized (a), optimally regularized (b) and over-regularized reconstructions (c) are presented. Panel (d) depicts the analytically computed L-curve curvature results for the sample points.
Fig. 2
Fig. 2
Comparing the different artifact reduction algorithms by taking projections over the lipid resonance frequencies (in dB scale). Gold standard reconstruction is obtained using 20 averages of high-resolution data without peripheral k-space undersampling (20 avghigh, Rhigh = 1, shown in (a)), while the basic proposed method is obtained using 2 averages of high-resolution data without undersampling (2 avghigh, Rhigh = 1, shown in (b)) and the refined proposed method uses 10-fold undersampled, 2 average high-resolution data (2 avghigh, Rhigh = 10, shown in (c)). Lipid suppression results obtained by using only lipid-basis penalty method and only dual-density approach are depicted in panels (d) and (e), respectively. Applying no lipid suppression (f) results in severely corrupted spectra.
Fig. 3
Fig. 3
Comparison between normalized root-mean-square error (NRMSE) values of NAA maps relative to the gold standard reconstruction.
Fig. 4
Fig. 4
Comparison between normalized root-mean-square error (NRMSE) values of NAA maps computed within the 9×9 cm2 excitation box relative to the NAA maps obtained with the OVS method. In (a), reconstruction results obtained using the gold-standard (20 avghigh, Rhigh = 1) method (blue) and the OVS spectra (black) belonging to the region inside the red box are also overplotted. In (b), the basic proposed method (blue) and the OVS spectra are compared. The spectra obtained with the refined method (blue) and the OVS results (black) are overplotted in (c). Lipid-basis penalty and OVS spectra are compared in (d).
Fig. 5
Fig. 5
Comparison of spectra inside the region of interest marked with the red box that were obtained with different lipid suppression methods. In (a), reconstruction results obtained using lipid-basis penalty method (blue) and the gold-standard reconstruction (black) are overplotted. In (b), the basic proposed method (blue) and the gold-standard spectra are presented. The spectra obtained with the refined method (blue) and the gold-standard results (black) are plotted in (c).
Fig. 6
Fig. 6
Comparison of spectra inside the region of interest marked with the red box that were obtained with different lipid suppression methods. Panel (a) overplots reconstruction results using lipid-basis penalty method (blue) and the gold-standard reconstruction (black). In (b), the basic proposed method (blue) and the gold-standard spectra are compared. The spectra obtained with the refined method (blue) and the gold-standard results (black) are depicted in (c).
Fig. 7
Fig. 7
Lipid and NAA maps and artifact-free spectra for the Cartesian synthetic phantom are shown in (a). In (b), spiral sampling trajectory at Nyquist rate and reconstruction results upon the application of lipid-basis penalty are depicted. Using the undersampled spiral trajectory in (c), a high-resolution lipid image was estimated using FOCUSS, from which a combined image was computed due to the dual-density method. Finally, lipid-basis penalty was applied to this combined image. Panel (d) shows lipid suppression results when the k-space is sampled only at half of the full resolution and lipid-basis penalty is applied. For the three reconstruction methods, the example spectra (plotted in blue) belong to the region of interest marked with the red box, and are overplotted with the artifact-free spectra (in black) for comparison.
Fig. 8
Fig. 8
Demonstration of approximate orthogonality between metabolite spectra obtained from in vivo OVS scan and lipid spectra from high resolution in vivo acquisition. In (a), the lipid and metabolite spectra with the highest orthogonality are plotted. In (b), the components of the metabolite spectrum that are orthogonal and parallel to the lipid spectrum for the best case in (a) are overplotted. The actual metabolite spectrum (in blue) is totally occluded by the orthogonal component (in orange). In (c), the lipid and metabolite spectra that are least orthogonal are depicted. In (d), the orthogonal and parallel components of the metabolite spectrum are overplotted for the worst case in (c). Panel (e) depicts the methodology used in computing the orthogonal and parallel metabolite components.

References

    1. Duyn JH, Gillen J, Sobering G, van Zijl PC, Moonen CT. Multisection proton MR spectroscopic imaging of the brain. Radiology. 1993;188(1):277–282. - PubMed
    1. Le Roux P, Gilles RJ, McKinnon GC, Carlier PG. Optimized outer volume suppression for single-shot fast spin-echo cardiac imaging. J Magn Reson Imaging. 1998;8(5):1022–1032. - PubMed
    1. Luo Y, de Graaf RA, DelaBarre L, Tannus A, Garwood M. BISTRO: an outer-volume suppression method that tolerates RF field inhomogeneity. Magn Reson Med. 2001;45(6):1095–1102. - PubMed
    1. Bydder GM, Young IR. MR imaging: clinical use of the inversion recovery sequence. J Comput Assist Tomogr. 1985;9(4):659–675. - PubMed
    1. Ebel A, Govindaraju V, Maudsley AA. Comparison of inversion recovery preparation schemes for lipid suppression in 1H MRSI of human brain. Magn Reson Med. 2003;49(5):903–908. - PubMed

Publication types