. 2012 Aug 15;53(9):5594-608.
doi: 10.1167/iovs.12-10070.

RPGR-associated retinal degeneration in human X-linked RP and a murine model

Affiliations

RPGR-associated retinal degeneration in human X-linked RP and a murine model

Wei Chieh Huang et al. Invest Ophthalmol Vis Sci. .

Abstract

Purpose: We investigated the retinal disease due to mutations in the retinitis pigmentosa GTPase regulator (RPGR) gene in human patients and in an Rpgr conditional knockout (cko) mouse model.

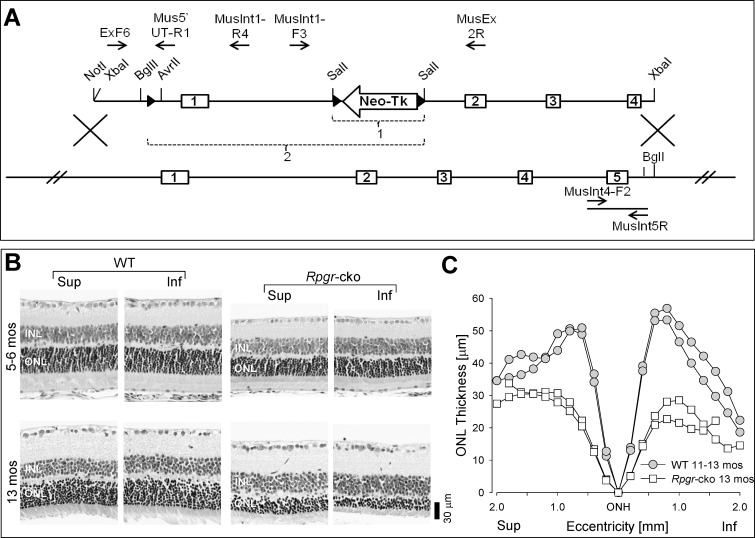
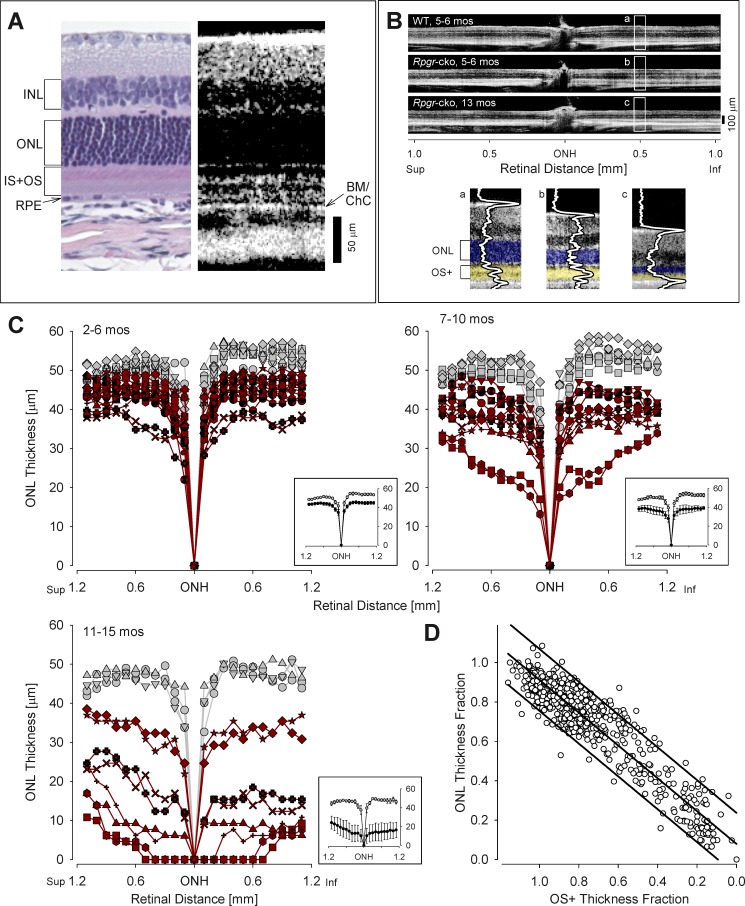
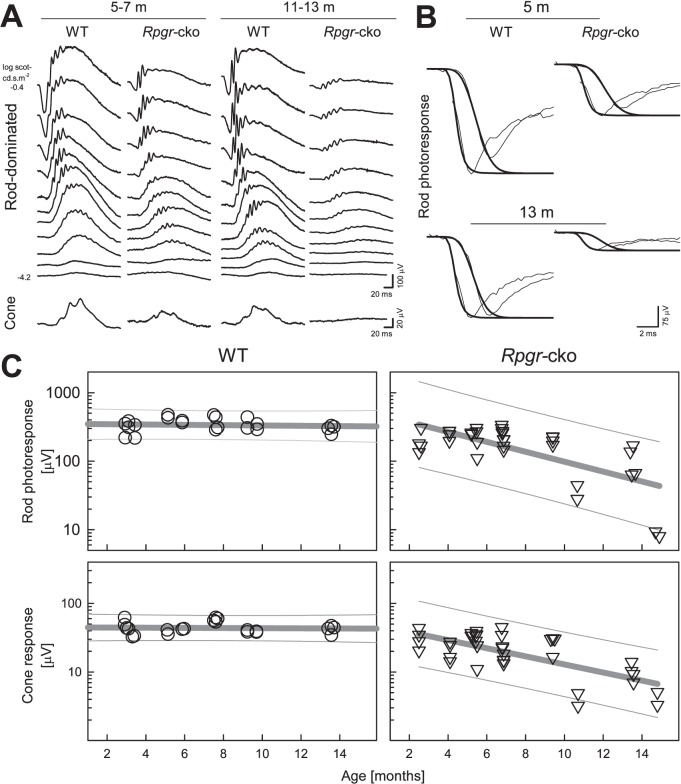
Methods: XLRP patients with RPGR-ORF15 mutations (n = 35, ages at first visit 5-72 years) had clinical examinations, and rod and cone perimetry. Rpgr-cko mice, in which the proximal promoter and first exon were deleted ubiquitously, were back-crossed onto a BALB/c background, and studied with optical coherence tomography and electroretinography (ERG). Retinal histopathology was performed on a subset.

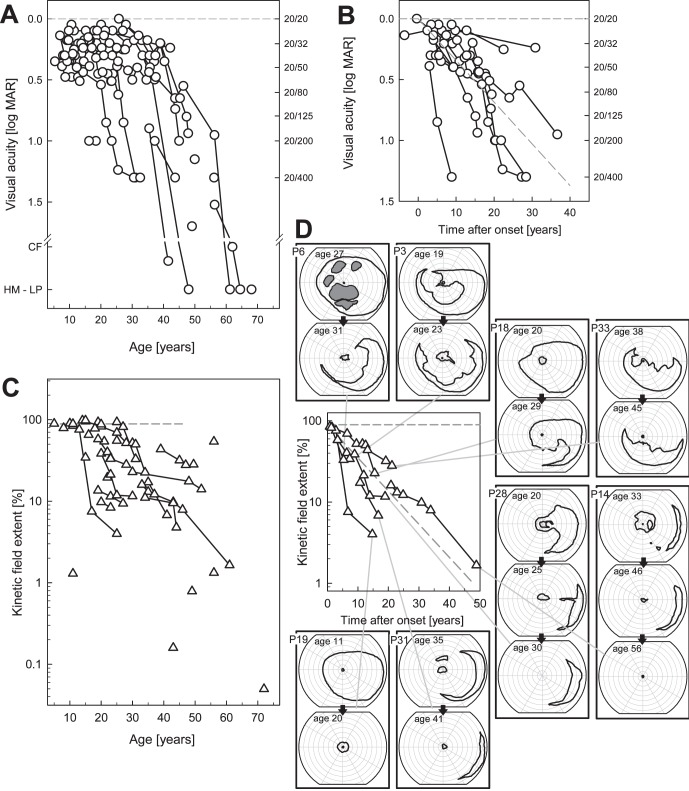
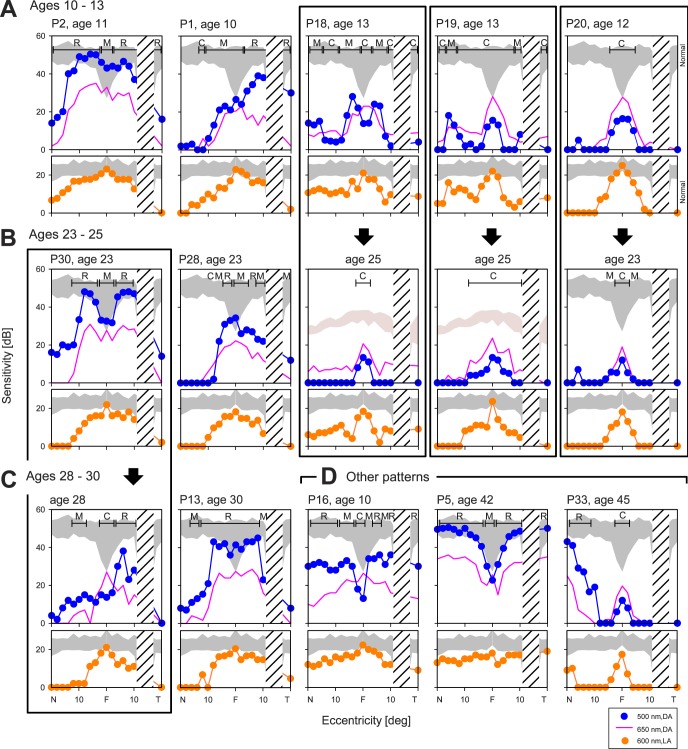
Results: Different patterns of rod and cone dysfunction were present in patients. Frequently, there were midperipheral losses with residual rod and cone function in central and peripheral retina. Longitudinal data indicated that central rod loss preceded peripheral rod losses. Central cone-only vision with no peripheral function was a late stage. Less commonly, patients had central rod and cone dysfunction, but preserved, albeit abnormal, midperipheral rod and cone vision. Rpgr-cko mice had progressive retinal degeneration detectable in the first months of life. ERGs indicated relatively equal rod and cone disease. At late stages, there was greater inferior versus superior retinal degeneration.

Conclusions: RPGR mutations lead to progressive loss of rod and cone vision, but show different patterns of residual photoreceptor disease expression. Knowledge of the patterns should guide treatment strategies. Rpgr-cko mice had onset of degeneration at relatively young ages and progressive photoreceptor disease. The natural history in this model will permit preclinical proof-of-concept studies to be designed and such studies should advance progress toward human therapy.


Conflict of interest statement

Disclosure: W.C. Huang, None; A.F. Wright, None; A.J. Roman, None; A.V. Cideciyan, None; F.D. Manson, None; D.Y. Gewaily, None; S.B. Schwartz, None; S. Sadigh, None; M.P. Limberis, None; P. Bell, None; J.M. Wilson, ReGenX Holdings (F, C), P; A. Swaroop, None; S.G. Jacobson, None

Figures

Figure 1.
Figure 1.
Visual acuity and kinetic perimetry results in RPGR-XLRP. (A) Visual acuity as a function of age in the entire cohort of 35 patients. Longitudinal data are shown as symbols connected by lines. (B) Subset of patients with longitudinal data and follow-up intervals from 3 to 28 years. To compare acuity changes in these patients, data were arranged as time after estimated onset of decline in acuity. Diagonal gray dashed line through the data: average of individual slopes. (C) Kinetic visual field extent (as % of normal mean) for the V-4e target as a function of age in the entire cohort; longitudinal data shown as symbols connected by lines. (D) Subset of patients with longitudinal data (follow-up intervals from 3–28 years) with data arranged as time after onset of decline of field extent. Diagonal dashed line: depicts the average of individual decline rates. Examples of kinetic visual field maps (to V- and I-4e targets) are shown at different ages for 8 of the patients (2 or 3 fields per patient are boxed together in the columns surrounding the graph). Patient number and ages are given, and each patient series is connected by lines to the data on the graph. Isopters for the I-4e target are interior to the V-4e isopters. Gray areas: absolute scotomas. All fields are depicted as right eyes.
Figure 2.
Figure 2.
Central rod and cone dysfunction in RPGR-XLRP at different ages. Dark-adapted two-color (500 nm, 650 nm) sensitivity profiles across the horizontal meridian (central 40°) in the patients (symbols are for 500 nm stimuli; continuous lines are 650 nm data) compared to normal (shaded bands, mean ± 2 SD, to 500 nm for rod sensitivity). The photoreceptor mediation at loci with function, based on the sensitivity difference between the two colors, is given. R, rod-mediated; M, mixed rod- and cone-mediated; C, cone-mediated. Light-adapted (600 nm) sensitivity profiles are shown for the same patients below the dark-adapted data. Shaded band: represents normal data (mean ± 2 SD). (A) Ages 10 to 13-year-old patients with different degrees of rod and cone dysfunction. (B) Ages 23 to 25-year-old patients with similar variations in rod and cone dysfunction as in the younger age group. Note that 3 of the 5 patients in the younger group have serial data (boxed together in columns) in their next decade of life and show that some of the residual rod function is lost over this interval (P18, P19, and P20). (C) Ages 28 to 30-year-old patients. P13, at age 30 shows normal central rod function and P30, followed longitudinally from age 23 until age 28 (boxed in a column), has a reduction in rod function over this interval. (D) Other patterns detected in the cohort of RPGR-XLRP patients included: a diffuse rod dysfunction at an early age (P16), normal rods and only slightly diminished cones (P5), and relatively preserved midperipheral rod and cone sensitivity, but only a small central island of cone-mediated vision (P33). F, central fixation locus; N, nasal; T, temporal visual field. Hatched areas: indicate position of the physiologic blind spot.
Figure 3.
Figure 3.
Patterns of rod and cone dysfunction across >70° of visual field in patients with RPGR-XLRP. (AC) Upper panels: dark-adapted sensitivity loss to the 500 nm stimulus (filled blue symbols). Lower panels: light-adapted sensitivity loss (orange filled symbols) to the 600 nm stimulus. Shaded bands: 2 SD limits from normal mean. The data in column B are postulated to be the psychophysical correlates to a histopathologic pattern reported previously for an XLRP postmortem donor retina. P20, P31, and P13 have residual central cones, and abnormal peripheral rods and cones. Serial data from P13 (at ages 30 and 48; boxed together with arrow between) suggest central rods precede the cone-only central pattern of column B. Data, such as those in the patients in column A (P3, P23, and P13), are proposed to be the earlier stage of the pattern in column B. A cone-only central island with no detectable mid- and far-peripheral function (column C) is a more advanced stage than in column B; this hypothesis is based on the longitudinal data in P31 (at ages 35 and 41; boxed with arrow). (D) Other patterns of rod and cone sensitivity losses are illustrated by data from P5, P33, and P15. The patient data are likely to represent different severity stages of the cone-rod dystrophy phenotype of RPGR-XLRP, which also has been documented in postmortem donor retina. F, central fixation locus.
Figure 4.
Figure 4.
Rpgr-cko mouse: genetic engineering and retinal histopathology at early and late ages. (A) Generation of Rpgr- cko mouse is illustrated with a cartoon of the targeting construct pBMR6XLLNTL (top) and the WT Rpgr locus (bottom). The Rpgr proximal promoter region and exon 1 are deleted (bracketed region labeled “2”). (B) Dorsal-ventral (superior-inferior) retinal sections in WT mice at two ages (5–6 and 13 months) compared to similar-aged Rpgr-cko mice. Inferior and superior retinal sections are illustrated for each age. Retinal sections are labeled for inner nuclear layer (INL) and ONL. (C) ONL thickness as a function of eccentricity along the vertical meridian crossing the ONH in WT (n = 2) and Rpgr-cko (n = 2) mice at the later ages (11–13 months). Sup, superior; Inf, inferior retina.
Figure 5.
Figure 5.
OCT abnormalities in Rpgr-cko mice. (A) Comparison of histologic and OCT sections in WT BALB/c mice illustrates the lamination patterns that appear with noninvasive optical imaging (4 months old, histologic section; 5 months old, OCT scan). BM/ChC, Bruch's membrane/choriocapillaris; IS+OS, inner segments +outer segments. (B) Representative OCT scans (top) across ∼2 mm of retina centered at the ONH, to illustrate ONL thickness changes with age in Rpgr-cko mice. Images from the inferior retina were magnified and overlaid with LRPs to demonstrate the reflective abnormalities in the outer retinal region in Rgpr-cko mice (b, c) compared with WT (a). OS+ is defined as the distance between the hyporeflective trough which is sclerad to OLM and the hyporeflective trough which is vitread to BM/ChC peak. (C) Superior-inferior OCT sections were quantified for ONL thickness in three age groups of Rpgr-cko mice (red symbols) and age-related WT mice (gray symbols). Insets: at lower right of each plot shows the mean ± 2 SE of the data. In the 2 to 6 months age group, 18 Rpgr-cko and 10 WT eyes were analyzed; in the 7 to 10 months age group, 12 Rpgr-cko and 8 WT eyes were analyzed; and in the 11 to 15 months age group, 8 Rpgr-cko and 4 WT eyes were analyzed. (D) ONL thickness fraction (locus and age specific) plotted as a function of OS+ thickness fraction. Graph: shows a linear relationship (with 95% prediction intervals) of photoreceptor nuclear loss and distal photoreceptor structure loss in Rpgr-cko mice (r2 = 0.89, P < 0.001).
Figure 6.
Figure 6.
Retinal function change with age in Rpgr-cko mice. (A) Dark-adapted ERG luminance-response series (upper set of waveforms) over a range from −4.2 to −0.4 log scot cd.s.m−2 blue flashes. There are reduced amplitudes to higher intensity stimuli in Rpgr-cko mice compared to WT waveforms at the ages of 5 to 7 and 11 to 13 months. ERG amplitudes are reduced in the older Rpgr-cko mouse compared to the younger mouse. Cone ERGs (lower row of waveforms) also show substantial abnormalities in amplitude. All traces start at flash onset. (B) Leading edges of dark-adapted ERG photoresponses evoked with 2.2 and 3.6 log scot cd.s.m−2 flashes (thin traces) fit as an ensemble with a model of rod phototransduction activation (thick traces). Representative results are shown for two ages. Note the substantially smaller responses from Rpgr-cko mice. (C) Top: rod photoreceptor function estimated with the maximum amplitude parameter of ERG photoresponses over the ages from 2 to 15 months in WT (left) and Rpgr-cko (right) mice. Below: Cone ERG amplitude as a function of age. Regression lines (thick gray) describe log-linear change of the parameters with age; 95% prediction intervals (thin gray lines) encompassing the data are also shown.

References

    1. Bird AC. X-linked retinitis pigmentosa. Br J Ophthalmol. 1975;59:177–199 - PMC - PubMed
    1. Wright AF. Towards the identification of genes in X-linked retinitis pigmentosa. Prog Ret Res. 1990;9:197–227
    1. Wright AF, Shu X. Focus on molecules: RPGR. Exp Eye Res. 2007;85:1–2 - PubMed
    1. Shu X, Black GC, Rice JM, et al. RPGR mutation analysis and disease: an update. Hum Mutat. 2007;28:322–328 - PubMed
    1. Sandberg MA, Rosner B, Weigel-DiFranco C, Dryja TP, Berson EL. Disease course of patients with X-linked retinitis pigmentosa due to RPGR gene mutations. Invest Ophthalmol Vis Sci. 2007;48:1298–1304 - PubMed

Publication types

MeSH terms