. 2012 Jul 17;3(4):e00151-12.
doi: 10.1128/mBio.00151-12. Print 2012.

Restricted gene flow among hospital subpopulations of Enterococcus faecium

Affiliations

Restricted gene flow among hospital subpopulations of Enterococcus faecium

Rob J L Willems et al. mBio. .

Abstract

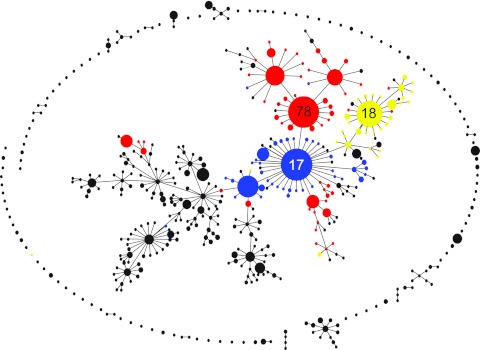
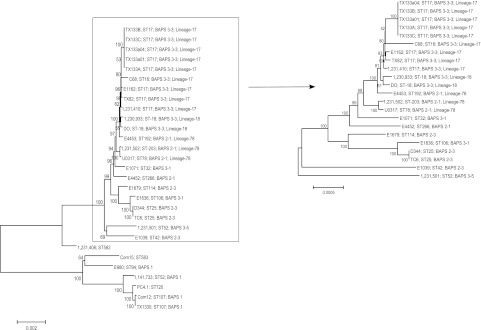
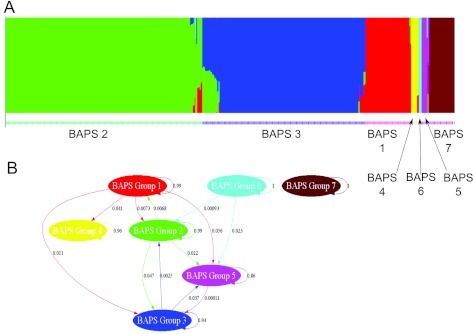
Enterococcus faecium has recently emerged as an important multiresistant nosocomial pathogen. Defining population structure in this species is required to provide insight into the existence, distribution, and dynamics of specific multiresistant or pathogenic lineages in particular environments, like the hospital. Here, we probe the population structure of E. faecium using Bayesian-based population genetic modeling implemented in Bayesian Analysis of Population Structure (BAPS) software. The analysis involved 1,720 isolates belonging to 519 sequence types (STs) (491 for E. faecium and 28 for Enterococcus faecalis). E. faecium isolates grouped into 13 BAPS (sub)groups, but the large majority (80%) of nosocomial isolates clustered in two subgroups (2-1 and 3-3). Phylogenetic and eBURST analysis of BAPS groups 2 and 3 confirmed the existence of three separate hospital lineages (17, 18, and 78), highlighting different evolutionary trajectories for BAPS 2-1 (lineage 78) and 3-3 (lineage 17 and lineage 18) isolates. Phylogenomic analysis of 29 E. faecium isolates showed agreement between BAPS assignment of STs and their relative positions in the phylogenetic tree. Odds ratio calculation confirmed the significant association between hospital isolates with BAPS 3-3 and lineages 17, 18, and 78. Admixture analysis showed a scarce number of recombination events between the different BAPS groups. For the E. faecium hospital population, we propose an evolutionary model in which strains with a high propensity to colonize and infect hospitalized patients arise through horizontal gene transfer. Once adapted to the distinct hospital niche, this subpopulation becomes isolated, and recombination with other populations declines.

Importance: Multiresistant Enterococcus faecium has become one of the most important nosocomial pathogens, causing increasing numbers of nosocomial infections worldwide. Here, we used Bayesian population genetic analysis to identify groups of related E. faecium strains and show a significant association of hospital and farm animal isolates to different genetic groups. We also found that hospital isolates could be divided into three lineages originating from sequence types (STs) 17, 18, and 78. We propose that, driven by the selective pressure in hospitals, the three hospital lineages have arisen through horizontal gene transfer, but once adapted to the distinct pathogenic niche, this population has become isolated and recombination with other populations declines. Elucidation of the population structure is a prerequisite for effective control of multiresistant E. faecium since it provides insight into the processes that have led to the progressive change of E. faecium from an innocent commensal to a multiresistant hospital-adapted pathogen.


Figures

FIG 1
FIG 1
eBURST-based population snapshot of E. faecium based on 519 STs representing 1,749 isolates contained in the online E. faecium MLST database (http://efaecium.mlst.net). STs belonging to lineages 17, 18, and 78 are color coded in blue, red, and yellow, respectively.
FIG 2
FIG 2
Minimum evolution tree based on the concatenated alignments of 299 orthologous proteins conserved in draft genome sequences of 29 E. faecium isolates. Bootstrap values are indicated and are based on 1,000 permutations. Strain codes are indicated as well as ST, BAPS group, and lineage based on their ST. Accession numbers: E. faecium 1231408, GenBank NZ_ACBB00000000; E. faecium 1231501, GenBank NZ_ACAY00000000; E. faecium TX0133A, GenBank NZ_AECH00000000; E. faecium TX0082, GenBank NZ_AEBU00000000; E. faecium C68, GenBank NZ_ACJQ00000000; E. faecium 1231410, GenBank NZ_ACBA00000000; E. faecium 1230933, GenBank NZ_ACAS00000000; E. faecium E4453, GenBank AEDZ00000000; E. faecium 1231502, GenBank NZ_ACAX00000000; E. faecium E4452, GenBank AEOU00000000; E. faecium D344, GenBank NZ_ACZZ00000000; E. faecium TC6, GenBank NZ_ACOB00000000; E. faecium Com15, GenBank NZ_ACBD00000000; E. faecium 1141733, GenBank NZ_ACAZ00000000; E. faecium PC4.1, GenBank NZ_ADMM00000000; E. faecium Com12, GenBank NZ_ACBC00000000; E. faecium TX1330, GenBank NZ_ACHL00000000; E. faecium E980, GenBank ABQA00000000; E. faecium E1039, GenBank ACOS00000000; E. faecium E1071, GenBank ABQI00000000; E. faecium E1162, GenBank ABQJ00000000; E. faecium E1636, GenBank ABRY00000000; E. faecium E1679, GenBank ABSC00000000; E. faecium U0317, GenBank ABSW00000000; E. faecium DO, GenBank NZ_ACIY00000000.1; E. faecium TX133a01, GenBank NZ_AECJ00000000.1; E. faecium TX133a04, GenBank NZ_AEBC00000000.1; E. faecium TX133B, GenBank NZ_AECI00000000.1; E. faecium TX133C, GenBank NZ_AEBG00000000.1. Strains 1231408, PC4.1, and Com15 lack a BAPS (sub)group designation because STs extracted from the genome sequences of these strains were not assigned yet at the time the BAPS analysis was performed. To improve resolution of the upper part of the tree, the top 22 non-BAPS 1 strains were separately clustered using the minimum evolution method.
FIG 3
FIG 3
Admixture analysis in the Enterococcus population. (Top) Admixture analysis of 519 distinct enterococcal genotypes. Each column represents a single MLST and is colored according to the proportion of genetic variation assigned to each BAPS group. The final cluster assignment is shown by the color underneath. (Bottom) Gene flow network identified in the Enterococcus population. Arrows indicate the average fraction of sequence variation obtained from the source cluster by clones assigned to the target cluster. Circular loops indicate the fraction of variation estimated as not arising from outside the BAPS group.

References

    1. Hidron AI, et al. 2008. NHSN annual update: antimicrobial-resistant pathogens associated with healthcare-associated infections: annual summary of data reported to the National Healthcare Safety Network at the Centers for Disease Control and Prevention, 2006–2007. Infect. Control Hosp. Epidemiol. 29:996–1011 - PubMed
    1. Homan WL, et al. 2002. Multilocus sequence typing scheme for Enterococcus faecium. J. Clin. Microbiol. 40:1963–1971 - PMC - PubMed
    1. Feil EJ, Li BC, Aanensen DM, Hanage WP, Spratt BG. 2004. eBURST: inferring patterns of evolutionary descent among clusters of related bacterial genotypes from multilocus sequence typing data. J. Bacteriol. 186:1518–1530 - PMC - PubMed
    1. Willems RJ, et al. 2005. Global spread of vancomycin-resistant Enterococcus faecium from distinct nosocomial genetic complex. Emerg. Infect. Dis. 11:821–828 - PMC - PubMed
    1. Willems RJ, Hanage WP, Bessen DE, Feil EJ. 2011. Population biology of Gram-positive pathogens: high-risk clones for dissemination of antibiotic resistance. FEMS Microbiol. Rev. 35:872–900 - PMC - PubMed

Publication types

MeSH terms

LinkOut - more resources