. 2012 Jul;10(7):e1001360.
doi: 10.1371/journal.pbio.1001360. Epub 2012 Jul 10.

Regulation of DNA replication within the immunoglobulin heavy-chain locus during B cell commitment

Affiliations

Regulation of DNA replication within the immunoglobulin heavy-chain locus during B cell commitment

Agnieszka Demczuk et al. PLoS Biol. 2012 Jul.

Abstract

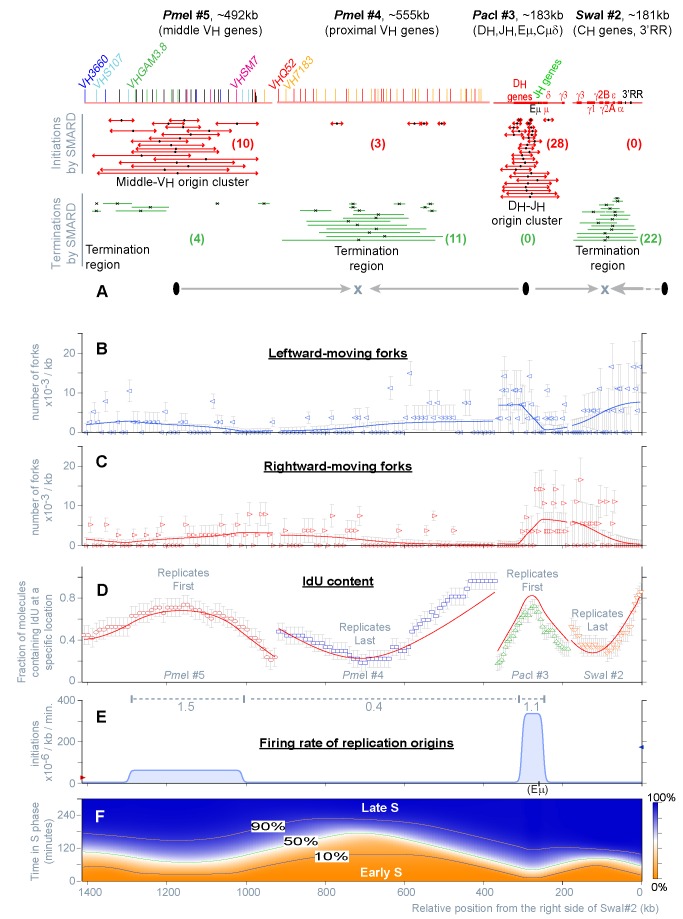
The temporal order of replication of mammalian chromosomes appears to be linked to their functional organization, but the process that establishes and modifies this order during cell differentiation remains largely unknown. Here, we studied how the replication of the Igh locus initiates, progresses, and terminates in bone marrow pro-B cells undergoing B cell commitment. We show that many aspects of DNA replication can be quantitatively explained by a mechanism involving the stochastic firing of origins (across the S phase and the Igh locus) and extensive variations in their firing rate (along the locus). The firing rate of origins shows a high degree of coordination across Igh domains that span tens to hundreds of kilobases, a phenomenon not observed in simple eukaryotes. Differences in domain sizes and firing rates determine the temporal order of replication. During B cell commitment, the expression of the B-cell-specific factor Pax5 sharply alters the temporal order of replication by modifying the rate of origin firing within various Igh domains (particularly those containing Pax5 binding sites). We propose that, within the Igh C(H)-3'RR domain, Pax5 is responsible for both establishing and maintaining high rates of origin firing, mostly by controlling events downstream of the assembly of pre-replication complexes.


Conflict of interest statement

The authors have declared that no competing interests exist.

Figures

Figure 1
Figure 1. Experimental system and approach used in this study.
(A) Map of the Igh locus (129/Sv) with approximate positions of the various gene families—constant (CH), joining (JH), diversity (DH), proximal-variable (proximal-VH; VH7183, VHQ52), middle-variable (middle-VH; VHS107), distal-variable (distal-VH; VHJ606, VHJ558, VH3609P)—and regulatory elements—intronic enhancer (Eμ), and 3′ regulatory region (3′RR). Gray bars indicate the positions of the four restriction fragments analyzed in this study. Note that while PmeI #5 and PmeI #4 span a continuous portion of the locus, a gap of ∼20 kb is present between the right end of PmeI #4 and the left end of PacI #3. A short overlap is also present between PacI #3 and SwaI #2. (B) Schematic representation of B cell development. Rag2 mediates the step of DNA cleavage during DH-JH and VH-DJH recombination. When this gene is mutated, cells cannot assemble the pre-B cell receptor and are unable to develop beyond the committed pro-B stage of differentiation. In contrast, Pax5 regulates the expression of hundreds of genes involved in B cell commitment, and in its absence, cell differentiation stops at the uncommitted pro-B cell stage. (C) SMARD. a–f represent examples of staining patterns for six hypothetical double-labeled DNA molecules. Diverging and converging forks indicate the occurrence of initiation and termination events. (D) Images of 12 actual molecules representative of the categories depicted in panel C. Each image is aligned to the map of the corresponding genomic fragment using the position of “landmark” hybridization probes as a reference. Arrowheads mark the position of the IdU-CldU transitions.
Figure 2
Figure 2. Replication of the Igh locus in Pax5 /− Rag2 /− uncommitted pro-B cells (129/Sv).
The panels containing experimental data (A–D) appear discontinuous because independent experiments were performed for each restriction fragment. (A) The top portion of this panel shows the schematics of the four restriction fragments depicted in Figure 1A (shown to scale). Red and green bars indicate the positions of the initiation and termination events detected by SMARD. Numerals indicate the normalized frequency of the events scored in each population of restriction fragments (this value represents an underestimate of the actual number of events taking place during every replication cycle, a fact that is taken in consideration by our mathematical model; see Materials and Methods). These events are organized from top to bottom by increasing size of the labeled region. Some bars are shown adjacent to each other to emphasize that they occupy non-overlapping locations; this does not mean that the events occurred on the same DNA molecule. The midpoint on each bar is marked by black symbols to indicate the most likely position of an active origin or fork collision. Gray arrows show the predominant directions of replication fork movement across the region. (B, C) Distribution of the replication forks moving leftward and rightward, from SMARD (empty symbols), and from the fit (line). Each value indicates the number of replication forks per kb (fork density) detected in the population of double-labeled DNA molecules after averaging the result over intervals of defined size (10 kb for the PmeI fragments, 5 kb for PacI#3 and SwaI#2). Trends in fork direction can be detected by comparing, for individual fragments, the densities shown in (B) and (C). The densities of different fragments cannot be compared directly because this value is a function of the replication time, which varies for each fragment (Table S1, Column i). Error bars were calculated as described in Materials and Methods. (D) IdU content of the population of double-labeled DNA molecules averaged over intervals of defined size (see panel B), obtained experimentally by SMARD (empty symbols), and from the fit (line). For each of the four restriction fragments, individual data points indicate the fraction of double-labeled molecules substituted with IdU within that interval. Since each fragment was studied individually, discontinuities are visible. However, adjacent fragments show similar trends in the shape of their graphs (increasing or decreasing), allowing us to deduce the position of the regions replicating first (peaks) and last (valleys). Error bars were calculated as described in Materials and Methods. (E) Distribution of the firing rate of origins across the Igh locus (blue line) and at adjacent genomic locations (red and blue arrows). Changes in the firing rate are shown continuously along the 1.4 megabase region spanned by the four restriction fragments. The firing rate is expressed in initiations/kb/minute to indicate that during each minute of the S phase, within a specific 1 kb section of the locus, a certain number of origins will fire in a population of 10−6 unreplicated DNA molecules (see also Table 1). This figure also shows the efficiency of origin firing within specific sections of the Igh locus (gray dashed lines), with gray numerals indicating the number of initiation events occurring in each region, per allele, per S phase (IAS). (F) Curves showing extent of DNA replication at different times in S phase for the various parts of the Igh locus (10%, 50%, and 90% replicated).
Figure 3
Figure 3. Replication of the Igh locus in a DH-JH rearranged clonal population of Pax5 /− uncommitted pro-B cells (129/Sv-C57BL/6).
The results for each allele are shown separately. Only two restriction fragments were analyzed (PacI #3 and SwaI #2). (A–F) Summary of the results obtained by SMARD from the analysis of 1,443 hybridization signals, yielding 532 fully substituted DNA molecules, 313 meeting the standards of measurement, for a total of 67 double-labeled molecules (see Table S1 for details). The results of the fitting procedure are shown as described for Figure 2.
Figure 4
Figure 4. Replication of the Igh locus in Rag2 /− committed pro-B cells (129/Sv).
(A–F) Summary of the results obtained by SMARD from the analysis of 973 fully substituted DNA molecules, 683 meeting the standards of measurement, for a total of 213 double-labeled molecules (see Table S1 for details). The results of the fitting procedure are shown as described for Figure 2. The locations of Pax5 binding sites in Rag2 / committed pro-B cells, as well as some chromatin modifications, are also indicated in panel E (see Materials and Methods for additional details).
Figure 5
Figure 5. Replication of the CH-3′RR region in KO-Pax5ER pro-B cells (129/Sv-C57BL/6).
(A) Kinetics of expression of CD19 after 4-OHT induction. The number of CD19+ cells reaches a plateau at about 30 h. (B) Scheme of Pax5ER induction and DNA labeling used for the SMARD. (C–H) Summary of the SMARD experiments performed to study the replication of CH-3′RR region before and after induction with 4-OHT (from the analysis of 1,832 fully substituted DNA molecules, 1,445 meeting the standards of measurement, for a total of 339 double-labeled molecules; Table S1). Each experiment is presented in a different column. Results for the two Igh alleles are shown separately (129/Sv, C57BL/6). The results of the fitting procedure are shown as described for Figure 2.
Figure 6
Figure 6. Kinetics of the changes in origin activity induced by 4-OHT (and by 4-OHT withdrawal) within the CH-3′RR region in KO-Pax5ER pro-B cells.
(A) Labeling scheme utilized for the time-course experiment in asynchronously growing cells. Tr indicates the time interval during which the double-labeled DNA molecules start replicating (see Table S1 for details). (B–G) Summary of the results obtained by SMARD from the analysis of 1,013 fully substituted DNA molecules, 818 meeting the standards of measurement, for a total of 202 double-labeled molecules (see Table S1 for details). The results of the fitting procedure applied to all experimental data sets obtained for the 129/Sv allele are shown as described for Figure 2. (H) Firing rate of origins calculated from the simultaneous fit of all experimental data sets obtained for the 129/Sv allele, including those presented in Figure 5 (**).

Similar articles

Cited by

References

    1. Hiratani I, Ryba T, Itoh M, Rathjen J, Kulik M, et al. Genome-wide dynamics of replication timing revealed by in vitro models of mouse embryogenesis. Genome Res. 2010;20:155–169. - PMC - PubMed
    1. Norio P, Kosiyatrakul S, Yang Q, Guan Z, Brown N. M, et al. Progressive activation of DNA replication initiation in large domains of the immunoglobulin heavy chain locus during B cell development. Mol Cell. 2005;20:575–587. - PubMed
    1. Aladjem M. I, Rodewald L. W, Lin C. M, Bowman S, Cimbora D. M, et al. Replication initiation patterns in the beta-globin loci of totipotent and differentiated murine cells: evidence for multiple initiation regions. Mol Cell Biol. 2002;22:442–452. - PMC - PubMed
    1. Goren A, Tabib A, Hecht M, Cedar H. DNA replication timing of the human beta-globin domain is controlled by histone modification at the origin. Genes Dev. 2008;22:1319–1324. - PMC - PubMed
    1. Kitsberg D, Selig S, Keshet I, Cedar H. Replication structure of the human beta-globin gene domain. Nature. 1993;366:588–590. - PubMed

Publication types

Substances

LinkOut - more resources