

Importance of electrostatic interactions in the association of intrinsically disordered histone chaperone Chz1 and histone H2A.Z-H2B
- PMID: 22807669
- PMCID: PMC3395605
- DOI: 10.1371/journal.pcbi.1002608
Importance of electrostatic interactions in the association of intrinsically disordered histone chaperone Chz1 and histone H2A.Z-H2B
Abstract
Histone chaperones facilitate assembly and disassembly of nucleosomes. Understanding the process of how histone chaperones associate and dissociate from the histones can help clarify their roles in chromosome metabolism. Some histone chaperones are intrinsically disordered proteins (IDPs). Recent studies of IDPs revealed that the recognition of the biomolecules is realized by the flexibility and dynamics, challenging the century-old structure-function paradigm. Here we investigate the binding between intrinsically disordered chaperone Chz1 and histone variant H2A.Z-H2B by developing a structure-based coarse-grained model, in which Debye-Hückel model is implemented for describing electrostatic interactions due to highly charged characteristic of Chz1 and H2A.Z-H2B. We find that major structural changes of Chz1 only occur after the rate-limiting electrostatic dominant transition state and Chz1 undergoes folding coupled binding through two parallel pathways. Interestingly, although the electrostatic interactions stabilize bound complex and facilitate the recognition at first stage, the rate for formation of the complex is not always accelerated due to slow escape of conformations with non-native electrostatic interactions at low salt concentrations. Our studies provide an ionic-strength-controlled binding/folding mechanism, leading to a cooperative mechanism of "local collapse or trapping" and "fly-casting" together and a new understanding of the roles of electrostatic interactions in IDPs' binding.
Conflict of interest statement
The authors have declared that no competing interests exist.
Figures
 ,
,  .
.  ,
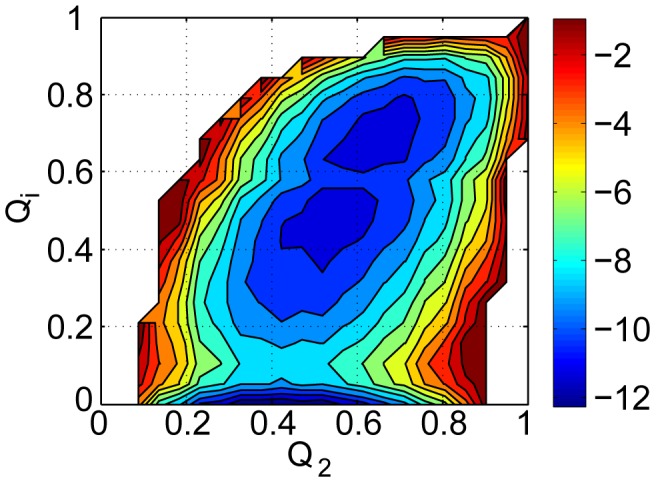
,  represent the structural similarity of inter-chain binding and intra-chain folding of Chz.core to the bound state in the binding process. The free energy profiles provide a global mechanism of the association. Free energy is in the unit of
  .
.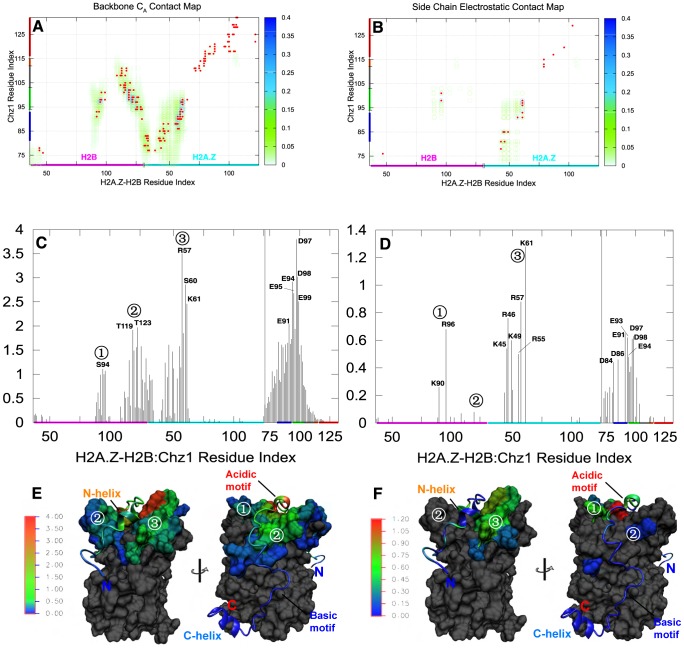
 contact map. (B) The side chain contact map for oppositely charged residues. The circles with gradational color changes represent the probability of contact existing in the transition state. Red points represent the contacts existed in the native structure. The average contact number of each residue formed by
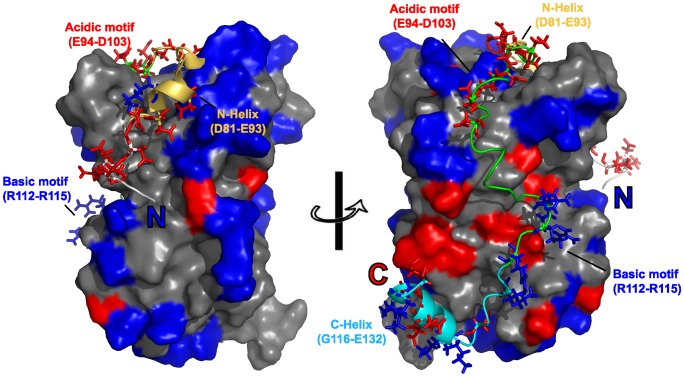
  and oppositely charged side chain interactions are represented in (C) and (D) and illustrated in (E) and (F) respectively. Different part of Chz.core are in different color representations in (A), (B), (C), (D): Blue, N-terminal helix; green, the acidic motif (residues 94–103); grey, the neutral motif (residues 104–111); orange, the basic motif (residues 112–115); red, C-terminal helix. The H2B and H2A.Z with residue sequence are marked on X-axis. The three “hot spot” regions of H2A.Z-H2B: (1) N88-T100 of H2B, (2) E109-A131 of H2B and Q29-A33 of H2A.Z,(3) Q38-A53 of H2A.Z are shown with numbers. In (E) and (F), the structures of bound state are color-coded according to the values of average contact number of residues in transition state. For a better visualization, the residues on H2A.Z-H2B which do not have inter-chain contacts are shown in grey.
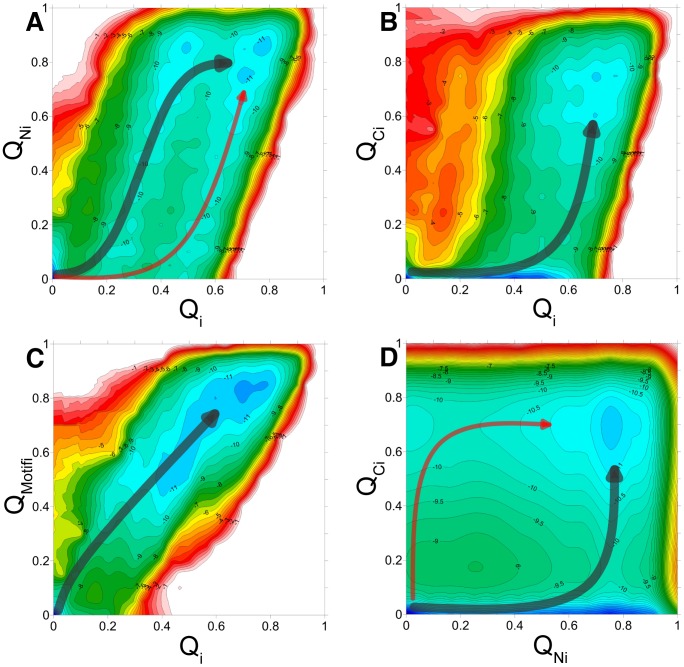
 and
and  , (B)
, (B)  and
and  , (C)
, (C)  and
and  , (D)
, (D)  and
and  .
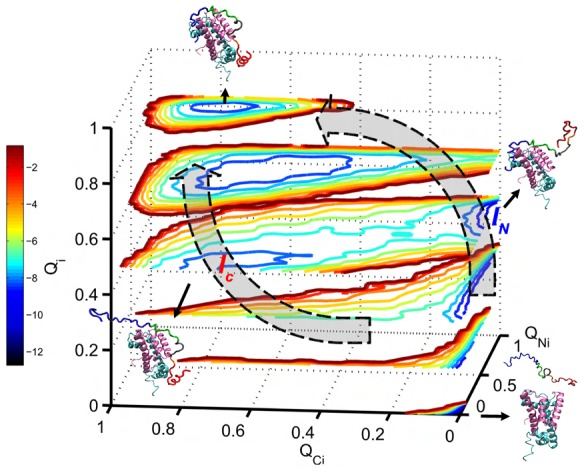
.  measures the global degree of binding process.
  ,
,  and
and  measure the degree of binding of N-helix, C-helix, Chz motif in Chz.core to the histones. There are two distinct binding pathways and intermediate states in (A), (D), only one pathway formed one intermediate state in (B) and only one pathway without intermediate state in (C). Free energy is in the unit of
  .
.
 ,
,  ,
,  .
.  ,
,  represent similarity of binding between N-helix and C-helix of Chz.core and histones to the bound state. There are two binding pathways connecting the unbound state and bound state. The two pathways go through intermediate
  and intermediate
  .
.  is more populated than
  as it shows a deeper free energy minima. The representative structures of bound state, intermediate
  ,
,  and unbound state are shown with color representation for Chz.core: Blue, N-terminal region; green, the acidic motif; grey, the neutral motif; orange, the basic motif; red, C-terminal helix. The missing backbone atoms of histones in coarse grained model are added for a better visualization. Free energy is in the unit of
  .
.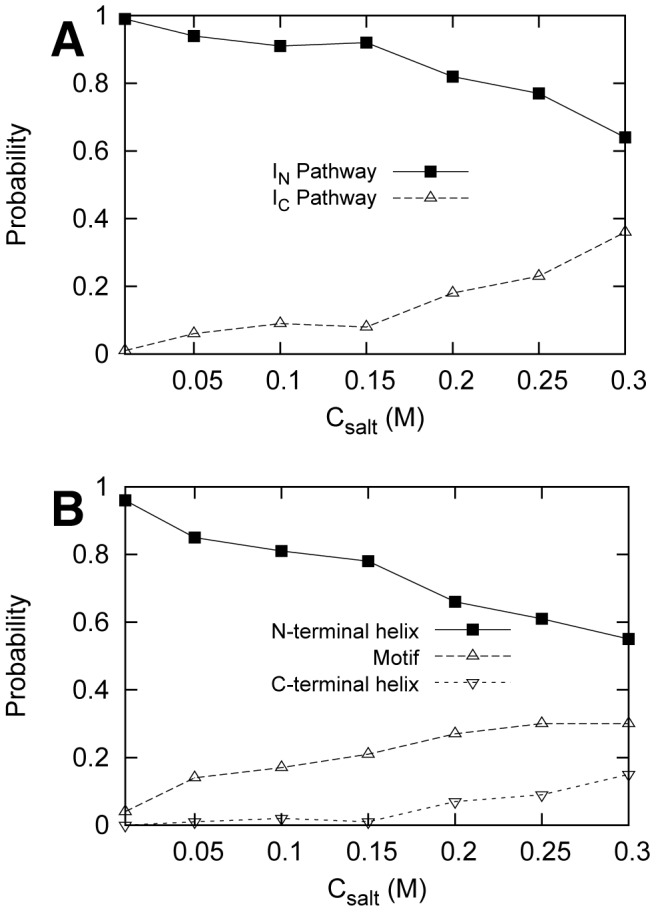
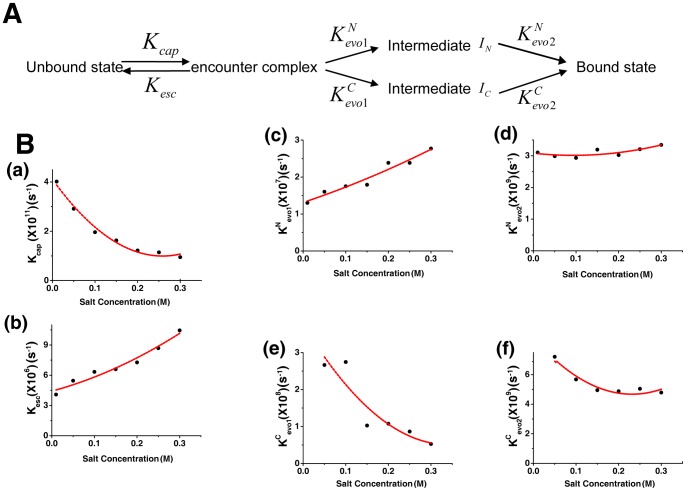
 and
and  are the rates from unbound states to encounter states and from encounter states to unbound states, respectively. The last two steps can be dissected into two parallel pathways, forming two different intermediate states.
  and
and  are the evolving rates from encounter states to intermediate states
  and from intermediate states
  to bound states, respectively. (B) The 6 typical rates at different salt concentrations. (a,b) The rate
  and
and  are shared by the two parallel pathways. The evolution rate in (c,d)
  binding pathway and (e,f)
  binding pathway shows different behavior as the salt concentration changes. All the rates are calculated by using transition number (N) and mean passage time (MPT). The dot lines are plotted to fit the grid data for a better visualization.
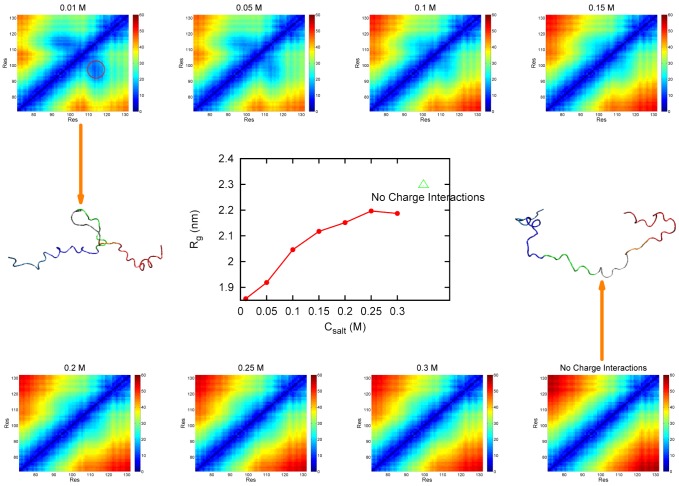
 picture. The picture in the center represents the radius of gyration
  of Chz.core changes with different salt concentrations. Simulations in the absence of charge-charge interactions are also performed and the data are plotted as a benchmark. As salt concentration increases,
  increases and the region of the collapsed structure becomes smaller and finally disappears. Two structures of Chz.core taken from the ensembles generated from
  and in the absence of charge-charge interactions are intended to assist visualization of the development of the distance distribution map. Color representation for Chz.core: Blue, N-terminal region; green, the acidic motif; grey, the neutral motif; orange, the basic motif; red, C-terminal helix. The side chain distance is in the unit of
  ,
,  is in the unit of
  .
.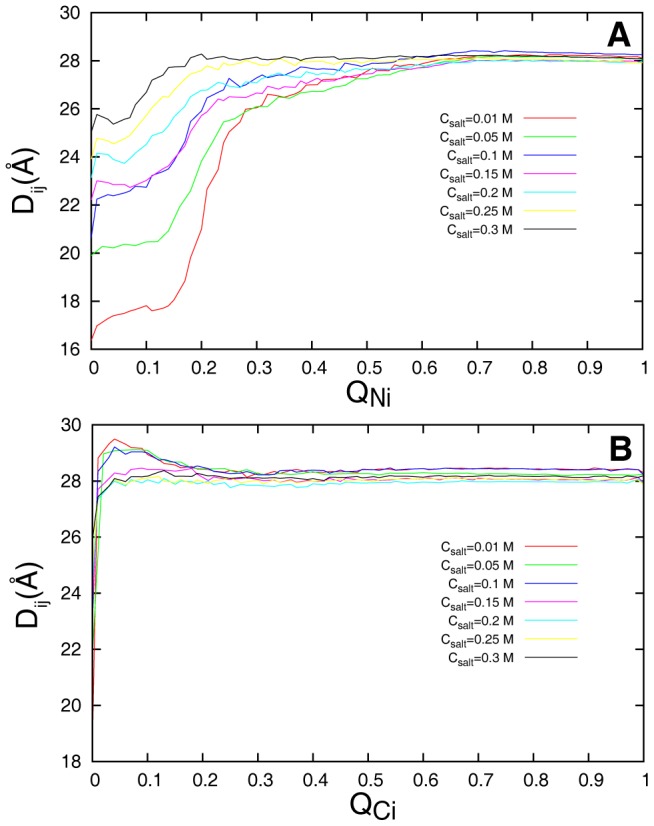
 and (B)
  . Different salt concentrations are represented by different colors.
Similar articles
-
Structural insights into histone chaperone Chz1-mediated H2A.Z recognition and histone replacement.PLoS Biol. 2019 May 20;17(5):e3000277. doi: 10.1371/journal.pbio.3000277. eCollection 2019 May. PLoS Biol. 2019. PMID: 31107867 Free PMC article.
-
Binding kinetics of histone chaperone Chz1 and variant histone H2A.Z-H2B by relaxation dispersion NMR spectroscopy.J Mol Biol. 2009 Mar 20;387(1):1-9. doi: 10.1016/j.jmb.2009.01.009. J Mol Biol. 2009. PMID: 19385041 Free PMC article.
-
Electrostatic forces govern the binding mechanism of intrinsically disordered histone chaperones.PLoS One. 2017 May 26;12(5):e0178405. doi: 10.1371/journal.pone.0178405. eCollection 2017. PLoS One. 2017. PMID: 28552960 Free PMC article.
-
Mechanistic and structural insights into histone H2A-H2B chaperone in chromatin regulation.Biochem J. 2020 Sep 18;477(17):3367-3386. doi: 10.1042/BCJ20190852. Biochem J. 2020. PMID: 32941645 Review.
-
Fly Fishing for Histones: Catch and Release by Histone Chaperone Intrinsically Disordered Regions and Acidic Stretches.J Mol Biol. 2017 Aug 4;429(16):2401-2426. doi: 10.1016/j.jmb.2017.06.005. Epub 2017 Jun 10. J Mol Biol. 2017. PMID: 28610839 Free PMC article. Review.
Cited by
-
Perspectives on the landscape and flux theory for describing emergent behaviors of the biological systems.J Biol Phys. 2022 Mar;48(1):1-36. doi: 10.1007/s10867-021-09586-5. Epub 2021 Nov 25. J Biol Phys. 2022. PMID: 34822073 Free PMC article. Review.
-
Polycation-π interactions are a driving force for molecular recognition by an intrinsically disordered oncoprotein family.PLoS Comput Biol. 2013;9(9):e1003239. doi: 10.1371/journal.pcbi.1003239. Epub 2013 Sep 26. PLoS Comput Biol. 2013. PMID: 24086122 Free PMC article.
-
Dynamic conformational change regulates the protein-DNA recognition: an investigation on binding of a Y-family polymerase to its target DNA.PLoS Comput Biol. 2014 Sep 4;10(9):e1003804. doi: 10.1371/journal.pcbi.1003804. eCollection 2014 Sep. PLoS Comput Biol. 2014. PMID: 25188490 Free PMC article.
-
Thermodynamic and sequential characteristics of phase separation and droplet formation for an intrinsically disordered region/protein ensemble.PLoS Comput Biol. 2021 Mar 8;17(3):e1008672. doi: 10.1371/journal.pcbi.1008672. eCollection 2021 Mar. PLoS Comput Biol. 2021. PMID: 33684117 Free PMC article.
-
Biochemical and Structural Insights into the Winged Helix Domain of P150, the Largest Subunit of the Chromatin Assembly Factor 1.Int J Mol Sci. 2022 Feb 15;23(4):2160. doi: 10.3390/ijms23042160. Int J Mol Sci. 2022. PMID: 35216276 Free PMC article.
References
-
- Kornberg RD. Chromatin structure - repeating unit of histones and DNA. Science. 1974;184:868–871. - PubMed
-
- Luger K, Mader AW, Richmond RK, Sargent DF, Richmond TJ. Crystal structure of the nucleosome core particle at 2.8 °A resolution. Nature. 1997;389:251–260. - PubMed
-
- Kornberg RD, Lorch YL. Twenty-five years of the nucleosome, fundamental particle of the eukaryote chromosome. Cell. 1999;98:285–294. - PubMed
-
- Laskey RA, Honda BM, Mills AD, Finch JT. Nucleosomes are assembled by an acidic protein which binds histones and transfers them to DNA. Nature. 1978;275:416–420. - PubMed
Publication types
MeSH terms
Substances
LinkOut - more resources
Full Text Sources
Molecular Biology Databases
