. 2012;8(7):e1002612.
doi: 10.1371/journal.pcbi.1002612. Epub 2012 Jul 12.

Rational engineering of enzyme allosteric regulation through sequence evolution analysis

Affiliations

Rational engineering of enzyme allosteric regulation through sequence evolution analysis

Jae-Seong Yang et al. PLoS Comput Biol. 2012.

Abstract

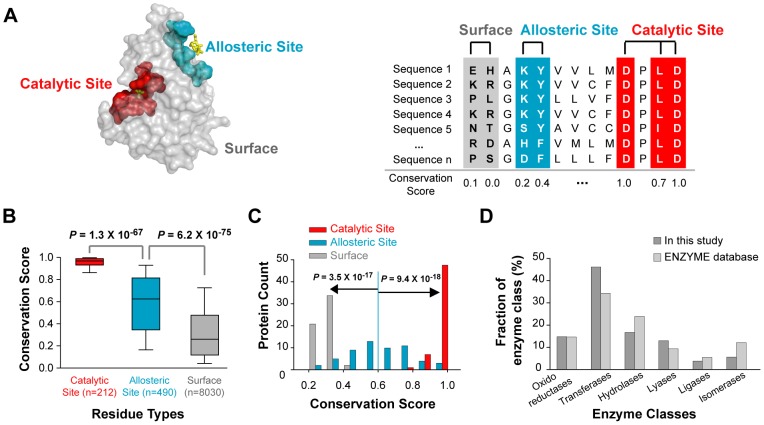
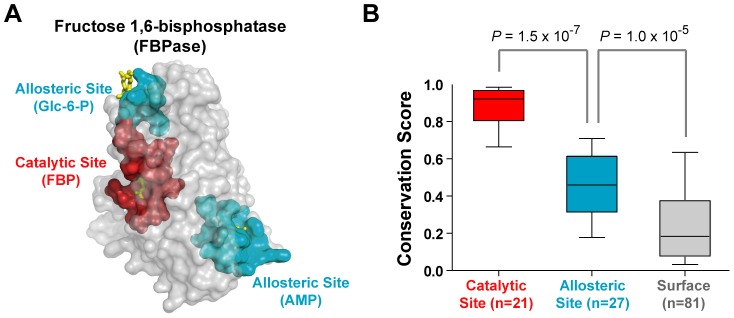
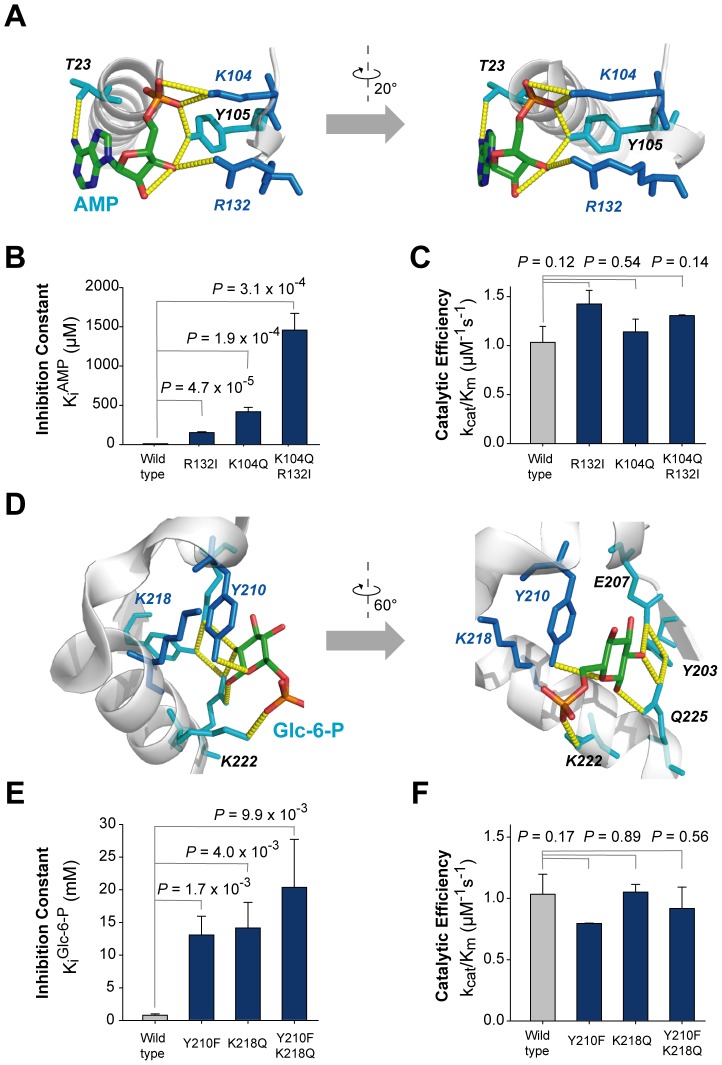
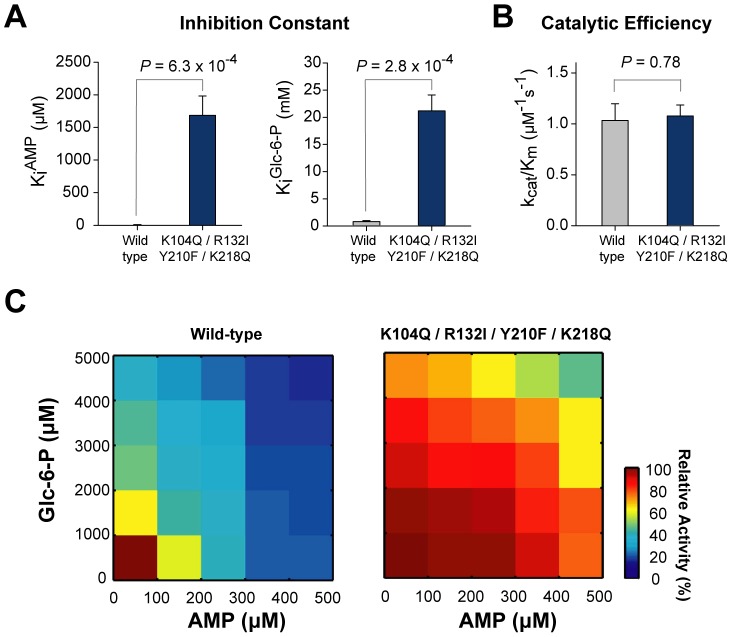
Control of enzyme allosteric regulation is required to drive metabolic flux toward desired levels. Although the three-dimensional (3D) structures of many enzyme-ligand complexes are available, it is still difficult to rationally engineer an allosterically regulatable enzyme without decreasing its catalytic activity. Here, we describe an effective strategy to deregulate the allosteric inhibition of enzymes based on the molecular evolution and physicochemical characteristics of allosteric ligand-binding sites. We found that allosteric sites are evolutionarily variable and comprised of more hydrophobic residues than catalytic sites. We applied our findings to design mutations in selected target residues that deregulate the allosteric activity of fructose-1,6-bisphosphatase (FBPase). Specifically, charged amino acids at less conserved positions were substituted with hydrophobic or neutral amino acids with similar sizes. The engineered proteins successfully diminished the allosteric inhibition of E. coli FBPase without affecting its catalytic efficiency. We expect that our method will aid the rational design of enzyme allosteric regulation strategies and facilitate the control of metabolic flux.


Conflict of interest statement

The authors have declared that no competing interests exist.

Figures

Figure 1
Figure 1. Investigation of conservation scores from catalytic and allosteric sites of enzymes.
(A) Representative mapping of catalytic, allosteric, and surface residues on 3D structures, represented in red, cyan, and gray, respectively. Allosteric sites of enzymes are generally located away from catalytic sites. Conservation scores were calculated for each residue from homologous sequences collected from the UniProtKB/SwissProt database. To compare conservation scores among different proteins, we applied the percentile normalization method. Conservation scores range from 0 to 1. Highly conserved residues get larger conservation scores. (B) Distributions of conservation scores for catalytic, allosteric, and surface residues. Shown are the distributions of conservation scores of residues collected from 56 allosteric proteins. The annotation of each residue comes from hand-curated databases. (C) Distributions of average conservation scores of catalytic, allosteric, and surface residues per protein. (D) Distributions of enzyme classes in our dataset and in the entire ENZYME database. The statistical significance (P-value) was measured by the Mann-Whitney U test.
Figure 2
Figure 2. Amino acid compositions of catalytic and allosteric residues.
The fraction of each amino acid of catalytic and allosteric residues is shown. Allosteric sites have more hydrophobic residues compared to catalytic sites, while catalytic sites have more charged amino acids than do allosteric sites. The statistical significance (P-value) was measured by Fisher's exact test; *P<0.05 and **P<0.005.
Figure 3
Figure 3. Comparison of evolutionary properties of catalytic and allosteric site residues of fructose 1,6-bisphosphatase (FBPase).
(A) Structure of the E.coli FBPase (PDB code 2Q8M). Catalytic site (21 residues) and allosteric site (27 residues) residues were defined as amino acid residues within 6 Å of the substrate, and represented in red and cyan colors, respectively. (B) Distributions of conservation scores for catalytic, allosteric, and surface residues. The statistical significance (P-value) was measured by the Mann-Whitney U test.
Figure 4
Figure 4. Mutations in each allosteric site of E. coli FBPase.
(A) Residues in the allosteric regulator AMP binding site. Four residues T23, K104, Y105, and R132 have hydrogen bonds and/or polar contacts, represented by yellow dotted lines, with AMP. The mutated positions are shown in blue and cyan. In particular, less conserved residues are shown in blue. (B) Comparison of inhibition constants of wild-type and mutant FBPase by the allosteric inhibitor, AMP. The statistical significance (P-value) was measured by t-test. (C) Comparison of the catalytic efficiencies of wild-type FBPase and AMP binding site mutants. (D) Residues in the allosteric regulator Glc-6-P binding site. Five residues Y203, E207, Y210, K222, and Q225 have hydrogen bonds and/or polar contacts, represented by yellow dotted lines, with Glc-6-P; K218 interlocks with Y210. The mutated positions are shown in blue and cyan. In particular, less conserved residues are shown in blue. (E) Comparison of inhibition constant of wild-type and mutant FBPase by the allosteric inhibitor, Glc-6-P. (F) Comparison of catalytic efficiencies of wild-type FBPase and Glc-6-P binding site mutants.
Figure 5
Figure 5. Combinatorial mutations of allosteric sites of E. coli FBPase.
(A) Comparison of inhibition constants of wild-type and mutant FBPase by AMP and Glc-6-P. The statistical significance (P-value) was measured by t-test. (B) Comparison of catalytic efficiencies of wild-type and mutant FBPase. (C) The profile of catalytic activities of wild-type and mutant FBPase in the presence of various concentrations of AMP and Glc-6-P. The range of AMP concentrations was 0–500 µM and that of Glc-6-P was 0–5000 µM.

Similar articles

Cited by

References

    1. Stadtman ER. Allosteric regulation of enzyme activity. Adv Enzymol Relat Areas Mol Biol. 1966;28:41–154. - PubMed
    1. Whitehead E. The regulation of enzyme activity and allosteric transition. Prog Biophys Mol Biol. 1970;21:321–397. - PubMed
    1. Kloosterman H, Hessels GI, Vrijbloed JW, Euverink GJ, Dijkhuizen L. (De)regulation of key enzyme steps in the shikimate pathway and phenylalanine-specific pathway of the actinomycete Amycolatopsis methanolica. Microbiology. 2003;149:3321–3330. - PubMed
    1. Suel GM, Lockless SW, Wall MA, Ranganathan R. Evolutionarily conserved networks of residues mediate allosteric communication in proteins. Nat Struct Biol. 2003;10:59–69. - PubMed
    1. Lee J, Natarajan M, Nashine VC, Socolich M, Vo T, et al. Surface sites for engineering allosteric control in proteins. Science. 2008;322:438–442. - PMC - PubMed

Publication types

MeSH terms

LinkOut - more resources