. 2012;8(7):e1002781.
doi: 10.1371/journal.ppat.1002781. Epub 2012 Jul 12.

Structural basis for the ABO blood-group dependence of Plasmodium falciparum rosetting

Affiliations

Structural basis for the ABO blood-group dependence of Plasmodium falciparum rosetting

Inès Vigan-Womas et al. PLoS Pathog. 2012.

Abstract

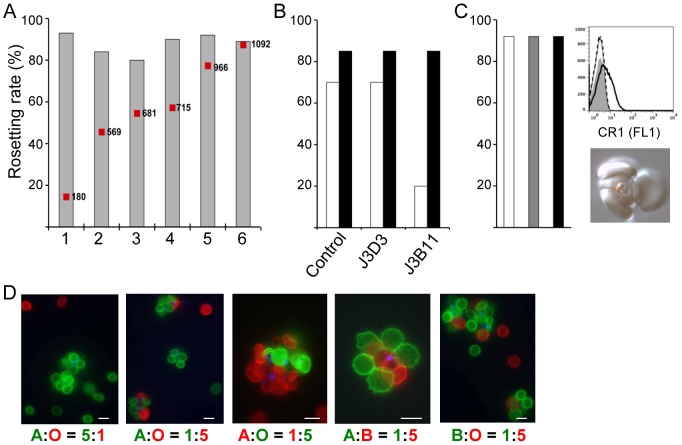
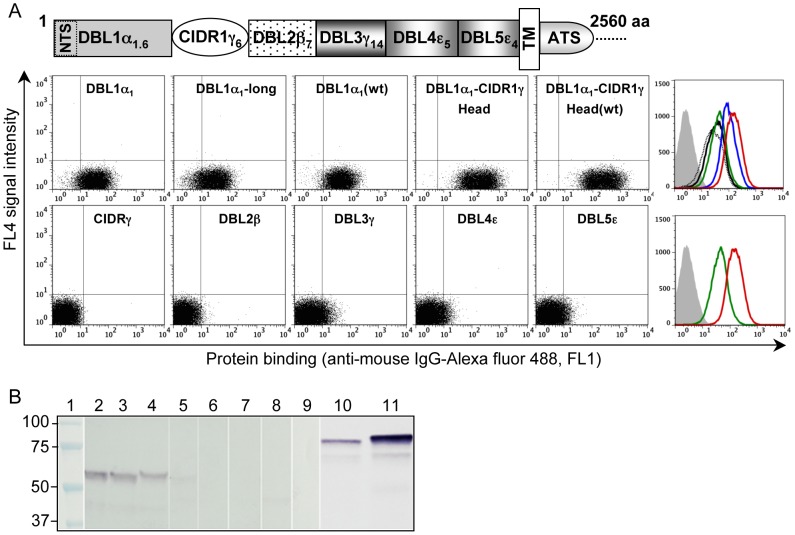
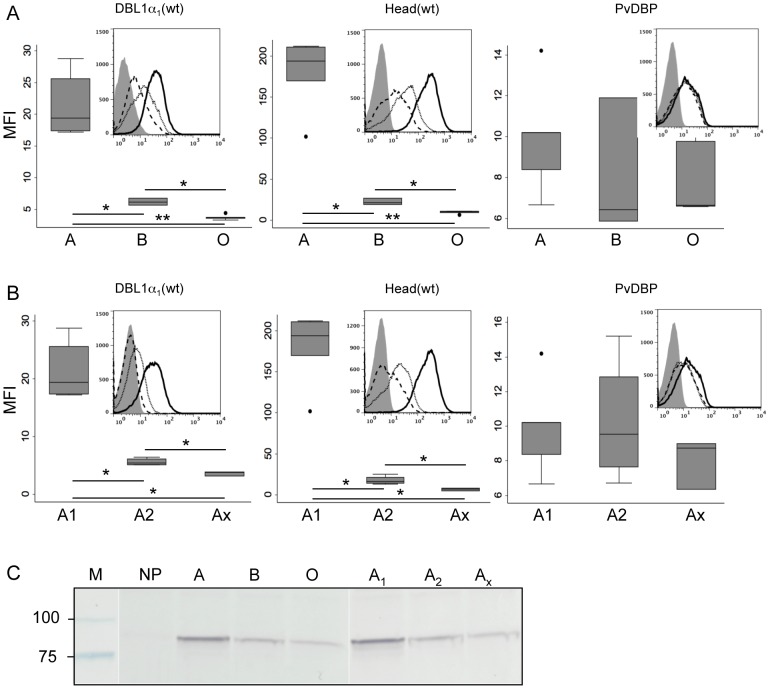
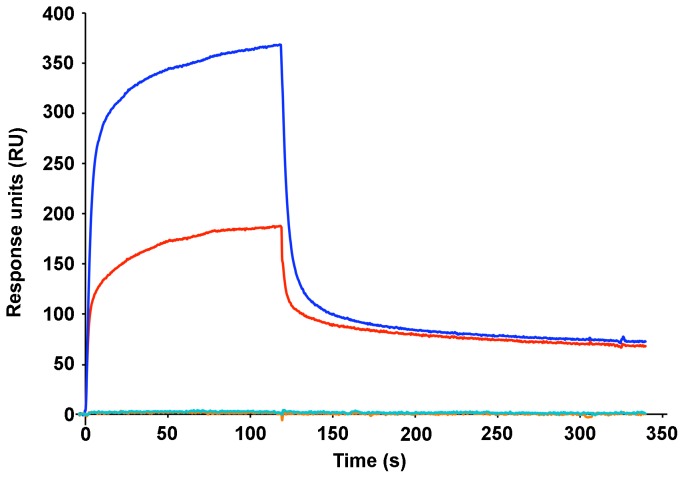
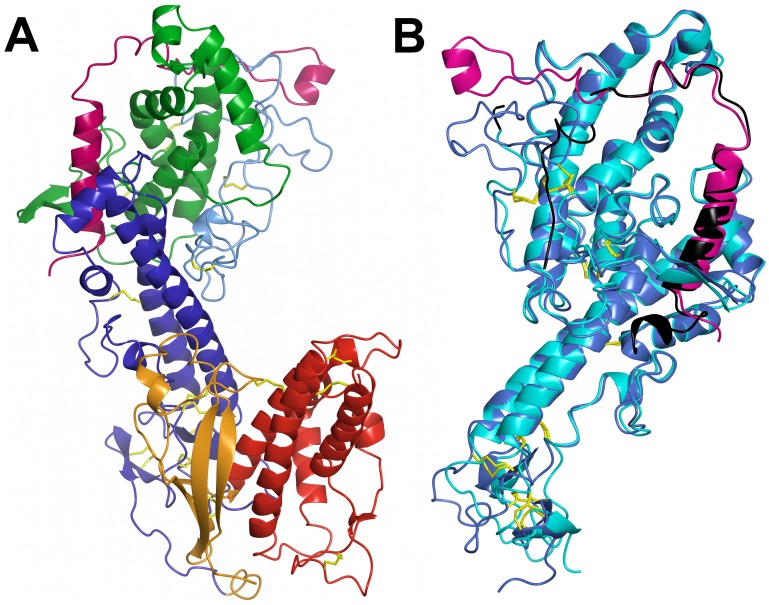
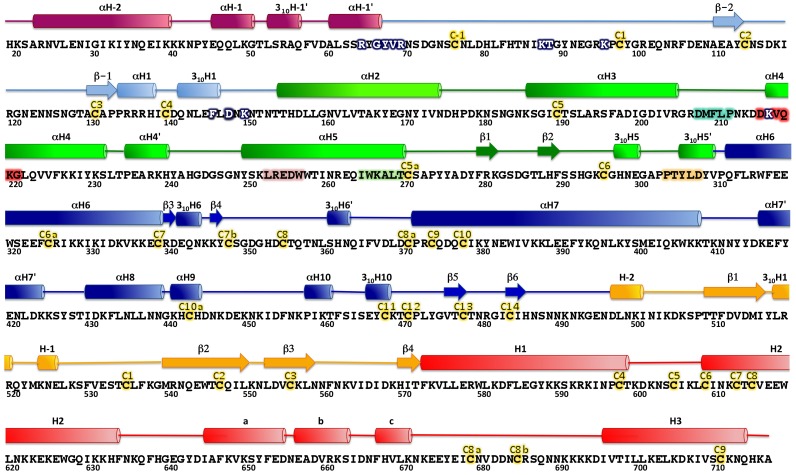
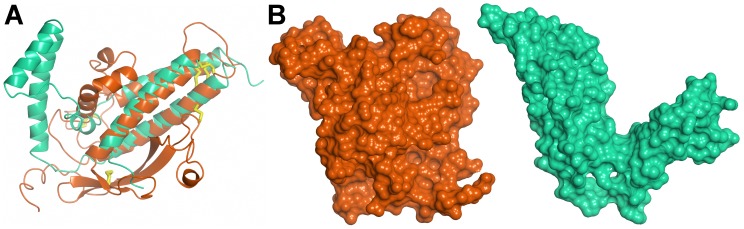
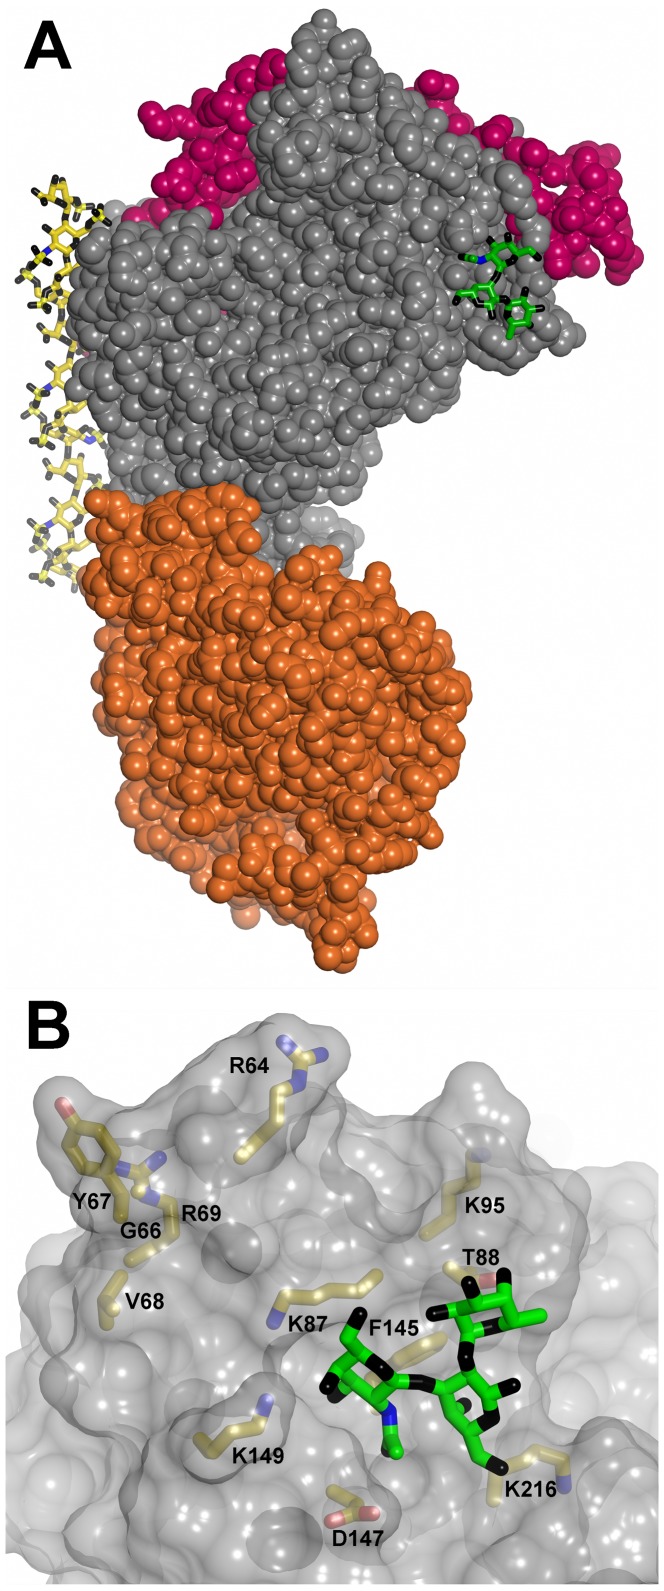
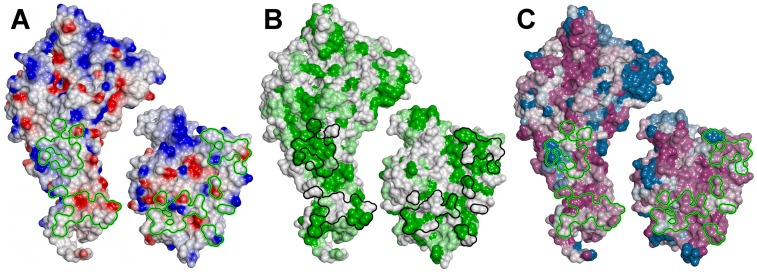
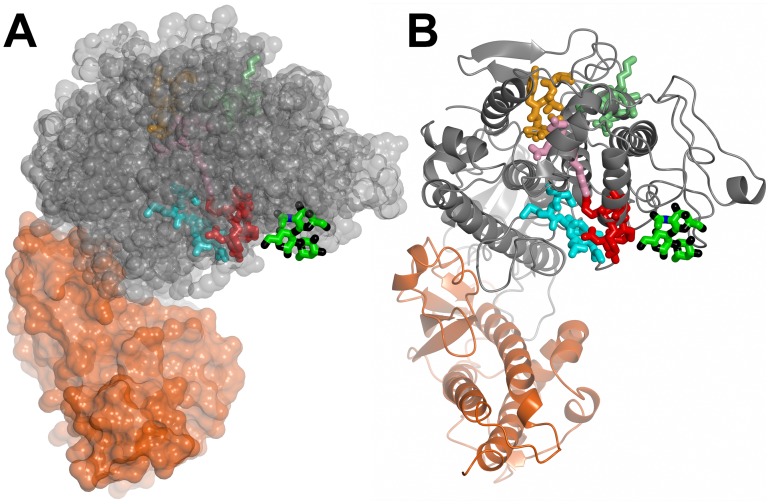
The ABO blood group influences susceptibility to severe Plasmodium falciparum malaria. Recent evidence indicates that the protective effect of group O operates by virtue of reduced rosetting of infected red blood cells (iRBCs) with uninfected RBCs. Rosetting is mediated by a subgroup of PfEMP1 adhesins, with RBC binding being assigned to the N-terminal DBL1α₁ domain. Here, we identify the ABO blood group as the main receptor for VarO rosetting, with a marked preference for group A over group B, which in turn is preferred to group O RBCs. We show that recombinant NTS-DBL1α₁ and NTS-DBL1α₁-CIDR1γ reproduce the VarO-iRBC blood group preference and document direct binding to blood group trisaccharides by surface plasmon resonance. More detailed RBC subgroup analysis showed preferred binding to group A₁, weaker binding to groups A₂ and B, and least binding to groups A(x) and O. The 2.8 Å resolution crystal structure of the PfEMP1-VarO Head region, NTS-DBL1α₁-CIDR1γ, reveals extensive contacts between the DBL1α₁ and CIDR1γ and shows that the NTS-DBL1α₁ hinge region is essential for RBC binding. Computer docking of the blood group trisaccharides and subsequent site-directed mutagenesis localized the RBC-binding site to the face opposite to the heparin-binding site of NTS-DBLα₁. RBC binding involves residues that are conserved between rosette-forming PfEMP1 adhesins, opening novel opportunities for intervention against severe malaria. By deciphering the structural basis of blood group preferences in rosetting, we provide a link between ABO blood grouppolymorphisms and rosette-forming adhesins, consistent with the selective role of falciparum malaria on human genetic makeup.


Conflict of interest statement

The authors have declared that no competing interests exist.

Figures

Figure 1
Figure 1. VarO rosetting is CR1 independent and ABO blood group dependent.
(A) Rosetting rate of monovariant Palo Alto 89F5 VarO parasites cultivated in RBC samples displaying distinct CR1 copy number, which was assessed using biotinylated anti-CR1/CD35 mAb J3D3 (red squares). Rosetting rates (grey bars) were assessed at similar parasitemia for all cultures. Growth and re-invasion rates were similar for all donors tested. (B) Rosette disruption assay with anti-CR1 mAbs J3D3 (IgG1) and J3B11 (IgG1), and a mouse IgG1 isotype control. Rosette-enriched Palo Alto 89F5 VarO (black bars) and IT4/R29 (open bars) parasites cultivated in the same batch of RBCs were diluted in the presence of 10 µg.mL−1 antibody and incubated at 37°C for 30 min before assessment of rosetting rate. (C) Rosette formation of VarO-iRBC with recipient RBCs where CR1 was enzymatically cleaved. The graph shows the rosetting rate of untreated recipient RBCs (white), trypsin-treated recipient RBCs (grey) and chymotrypsin-treated recipient RBCs (black). The upper inset shows a histogram representation (CR1 expression level vs. cell count) of a typical CR1 flow cytometry detection assay using mAb J3B11: untreated RBCs (black curve); trypsin-treated RBCs (dotted curve); chymotrypsin-treated RBCs (dashed curve); background labelling (filled grey curve). The lower inset shows a typical VarO-iRBC rosette formed with trypsin-treated recipient RBCs. (D) ABO blood group preference of Palo Alto 89F5 VarO-iRBCs. Purified VarO-iRBCs were incubated in the presence of varying ratios of recipient A, B and O RBCs differentiated by labelling alternately with the lipophilic fluorescent probes PKH26 or PKH67. Images shown were at a ×40,000 or ×100,000 magnification. At the bottom of each panel, the scale bars correspond to 7 µm. The rosetting rate was evaluated by fluorescence microscopy. A representative result of at least three independent assays is shown.
Figure 2
Figure 2. RBC binding capacity of soluble recombinant PfEMP1-VarO domains.
A schematic representation of the PfEMP1-VarO domain organisation is shown in the upper part of the figure. The six individual recombinant domains and the Head were produced as soluble proteins in E. coli (see Figure S2). Binding to freshly collected blood group A1 RBCs was assayed at identical molar concentrations of recombinant protein and visualised using polyclonal mouse antibodies raised to the cognate domain and goat anti-mouse IgG labelled with Alexa fluor-488 or alkaline phosphatase. (A) Dot plot representation of flow cytometry analysis of the binding of DBL1α1, DBL1α1-long, DBL1α1(wt), Head, Head(wt), CIDR1 γ, DBL2β, DBL3γ, DBL4ε and DBL5ε. The right panels show histograms of representative results (FL1-MFI vs. cell counts) of RBC binding assays: background labelling - no protein added - (filled gray), DBL1α1(black), DBL1α1(wt)(green), DBL1α1-long (dotted black); Head (blue) and Head(wt)(red). (B) Representative immunoblot results of RBC binding: Molecular mass markers (lane 1), DBL1α1 (lane 2); DBL1α1(wt)(lane 3); DBL1α1-long (lane 4); CIDR1γ (lane 5); DBL2β (lane 6); DBL3γ (lane 7); DBL4ε (lane 8); DBL5ε (lane 9); Head (lane 10); Head(wt)(lane 11).
Figure 3
Figure 3. ABO Blood group preference of PfEMP1-VarO adhesion domains.
Binding of DBL1α1(wt), Head(wt) and PvDBP recombinant domains to A, B or O RBCs and blood group A subgroups. Box plot representation of the mean fluorescence intensity (MFI) of protein binding to (A) a panel of cryo-preserved RBCs from reference blood donors [A (n = 5), B (n = 3) and O (n = 5)] and (B) blood group A subgroups [A1 (n = 5), A2 (n = 4) and Ax (n = 3)]. The boundaries of the boxes indicate the 25th and 75th percentiles, the line in each box indicates the median and the whiskers indicate the 10th and 90th percentiles. The outlying dots show values exceeding the 10th and 90th percentiles. The background reactivity of the antibodies to the different RBCs (no recombinant protein added) was 2±0.5 MFI Units. The results of Kruskal-Wallis nonparametric test are indicated by asterisks, as follows: *, P<0.05; **, P<0.01. The insets show for each binding experiment the flow cytometry histograms of a representative binding to an individual donor from each blood group. (A) binding to A (black curve), B (dotted curve) and O (dashed curve); (B) binding to A1 (black curve), A2 (dotted curve) and Ax (dashed curve); the background labelling is represented in grey filled curve. (C) Immunoblot analysis of Head(wt) binding to a representative individual donor from each blood group A, B, O, A1, A2 and Ax; M, molecular mass markers; NP, no protein.
Figure 4
Figure 4. Direct binding to blood group trisaccharides assayed by surface plasmon resonance.
Representative real-time association and dissociation profiles corresponding to the injection of the Head(wt) region (175 nM) over trisaccharide A (blue) or trisaccharide B (red) conjugated BSA. Premixing the Head(wt) region with a 2-fold excess of heparin resulted in no detectable binding to either conjugate (cyan and orange profiles for trisaccharide A- and trisaccharide B-BSA, respectively).
Figure 5
Figure 5. Structure of the DBL1α1-CIDR1γ VarO-Head region.
(A) Overall view of the structure of the Head region with subdomains coloured as in Figure 6. (B) Superposition of the DBL1α1 structure determined earlier (in cyan) upon the DBL1α1 domain in the Head structure (in blue). The NTS region is in black for the earlier cleaved structure and in mauve for the Head structure. The view is rotated 180° from (A).
Figure 6
Figure 6. Sequence and secondary structure of DBL1α1-CIDR1γ VarO-Head region.
The sequence is indicated in single letter code. Cylinders represent helices and arrows represent β strands. NTS is mauve; DBL1α1 subdomains 1, 2, and 3 are light blue, green, and blue, respectively, while CIDR1γsubdomains 1 and 2 are orange and red, respectively. Cysteines, given by their canonical nomenclature, are in yellow. DBL1α1 helices up to αH8 without primes (′) refer to helices common to all known DBL structures. Mutations that affect RBC binding are highlighted as white letters on a dark blue background. The sequences corresponding to the PolV tags are shown with backgrounds cyan (PolV1), pink (PolV2), green (PolV3) and orange (PolV4). Motif H3 is shown in red.
Figure 7
Figure 7. Structure of the CIDR1γ-VarO domain.
(A) Superposition of the CIDR1γ -VarO domain (orange) upon the CIDRα-MC179 domain (turquoise). (B) Space-filling representation of CIDR1γ -VarO and CIDRα-MC179 domains.
Figure 8
Figure 8. Localisation of the RBC binding site.
(A) An overall view of the Head in a space-filling representation (NTS region in mauve, DBL1α1 domain in grey, CIDR1γ domain in orange) with the docked blood group A trisaccharide (green- carbon, black - oxygen and blue - nitrogen) and heparin (carbons in yellow) molecules in stick representation. (B) Detail of the RBC-binding site with side chains whose mutations affect binding highlighted (carbons in yellow, nitrogens in blue and oxygens in red).
Figure 9
Figure 9. Interface between the DBL1α1 and CIDR1γ VarO domains.
The two domains are represented with the contact surface, normally buried in the interface, facing the viewer (A) Electrostatic surface (red - negative and blue - positive; the scale is from −0.046 to 0.051 kT.e−1); (B) hydrophobic surface (green - hydrophobic, white - hydrophillic); (C) residue conservation across DBL1α1-CIDR1γ PfEMP1 proteins (from dark purple - highly conserved to blue - variable). The outline of the contact surface is shown as a green and black line.
Figure 10
Figure 10. Localisation of the PolV1-4 and High rosetting motif H3 relative to the RBC binding site on DBL1α1.
The PolV tags are shown in stick representation: PolV1 (sequence DMFLP, cyan), PolV2 (sequence LREDW, pink), PolV3 (sequence IWKALT, pale green) and PolV4 (sequence PTYLD, orange). Motif H3 is shown in red. The docked trisaccharide is shown as in Figure 8. (A) Space-filling representation and (B) ribbon representation. PolV2 and 3 lie in αH5, PolV4 motif is the main constituent of αH5′. PolV1 tag is located between αH3 and αH4, in the area adjacent to the binding site. All PolV are part of the scaffold and not accessible to the surface. Palo Alto 89F5 VarO has a H3 motif located at the beginning of αH4 (shown in red), which is surface exposed and located adjacent to the trisaccharide binding site. Motif H2 (TCA/GAK/TV/M) is located at the end of αH5 and is not well conserved in VarO (its sequence is TC270 SAPY). It is situated on the opposite face with respect to motif H3 and the RBC binding site (not shown). Motif H1 (RFSKN) is not present in VarO.

Comment in

Similar articles

Cited by

References

    1. Boren T, Falk P, Roth KA, Larson G, Normark S. Attachment of Helicobacter pylori to human gastric epithelium mediated by blood group antigens. Science. 1993;262:1892–1895. - PubMed
    1. Hutson AM, Atmar RL, Graham DY, Estes MK. Norwalk virus infection and disease is associated with ABO histo-blood group type. J Infect Dis. 2002;185:1335–1337. - PubMed
    1. Lindesmith L, Moe C, Marionneau S, Ruvoen N, Jiang X, et al. Human susceptibility and resistance to Norwalk virus infection. Nat Med. 2003;9:548–553. - PubMed
    1. Marionneau S, Ruvoen N, Le Moullac-Vaidye B, Clement M, Cailleau-Thomas A, et al. Norwalk virus binds to histo-blood group antigens present on gastroduodenal epithelial cells of secretor individuals. Gastroenterology. 2002;122:1967–1977. - PMC - PubMed
    1. Ruiz-Palacios GM, Cervantes LE, Ramos P, Chavez-Munguia B, Newburg DS. Campylobacter jejuni binds intestinal H(O) antigen (Fuc alpha 1, 2Gal beta 1, 4GlcNAc), and fucosyloligosaccharides of human milk inhibit its binding and infection. J Biol Chem. 2003;278:14112–14120. - PubMed

Publication types

MeSH terms

Substances

Associated data