. 2012;8(7):e1002821.
doi: 10.1371/journal.pgen.1002821. Epub 2012 Jul 12.

Functional evolution of mammalian odorant receptors

Affiliations

Functional evolution of mammalian odorant receptors

Kaylin A Adipietro et al. PLoS Genet. 2012.

Abstract

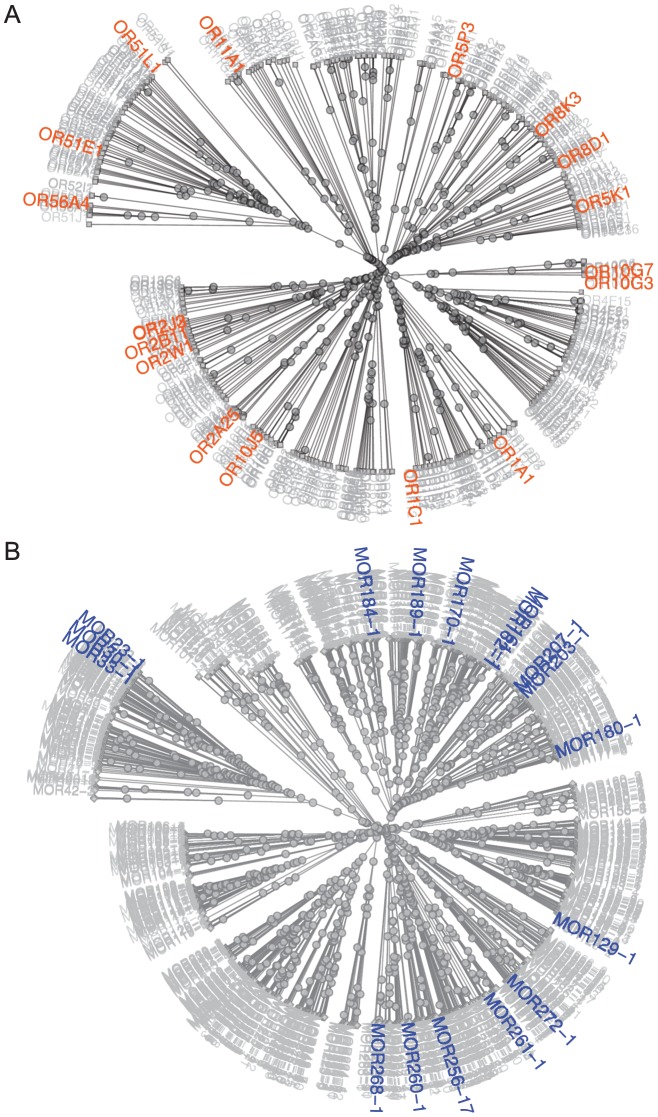
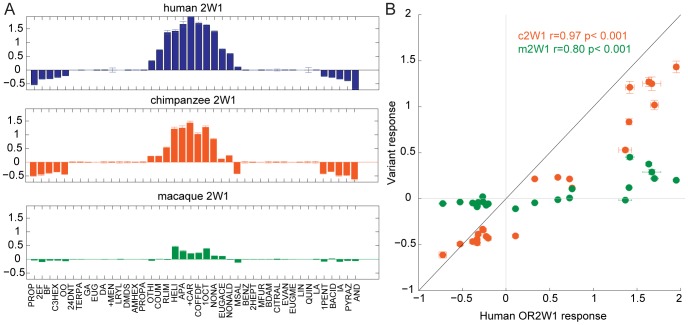
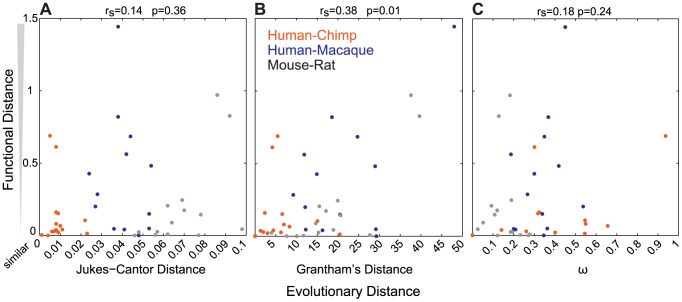
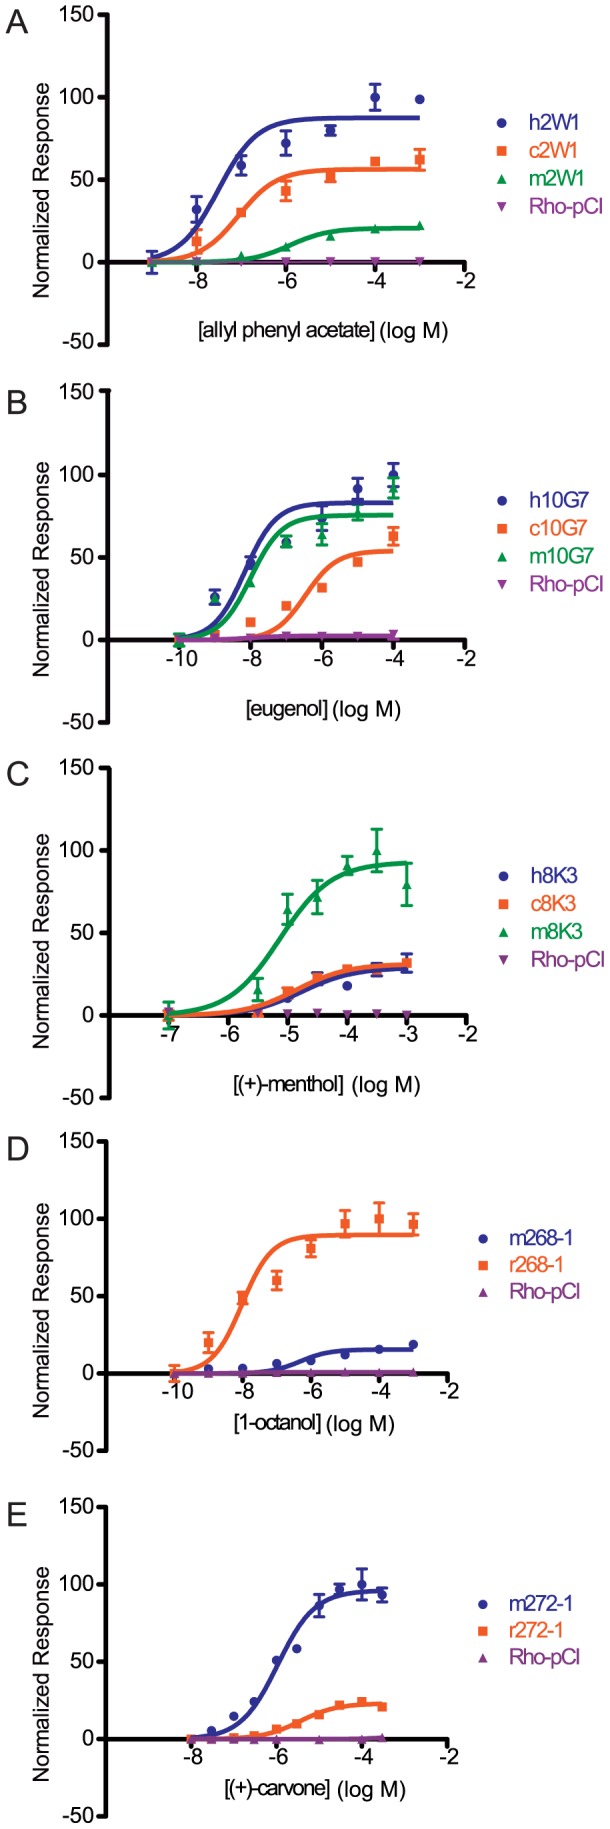
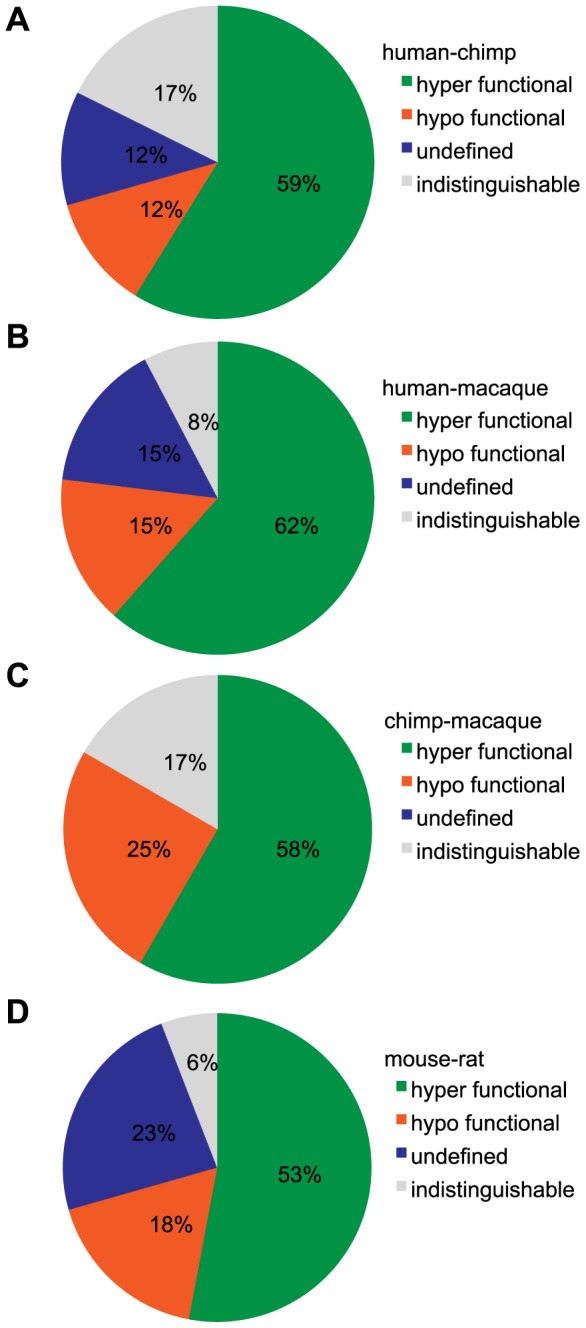
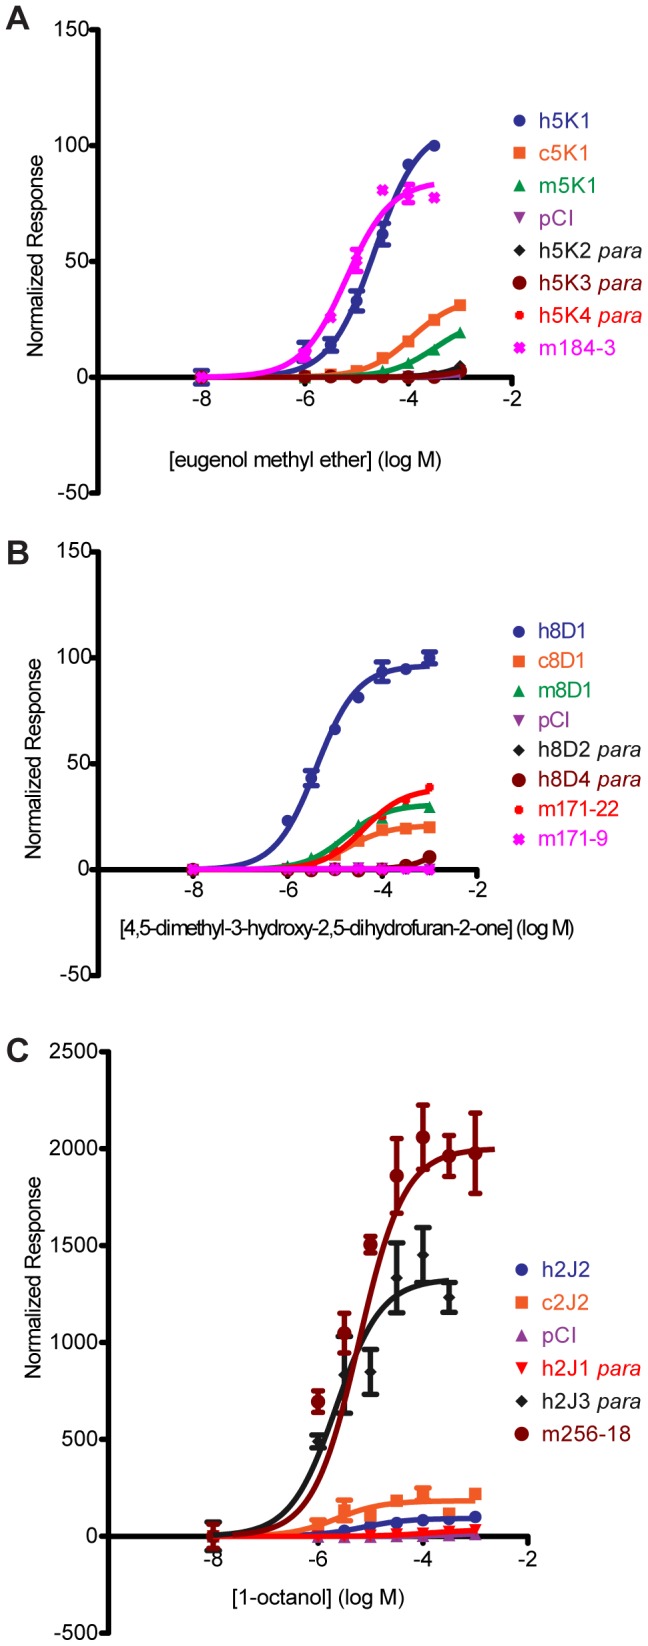
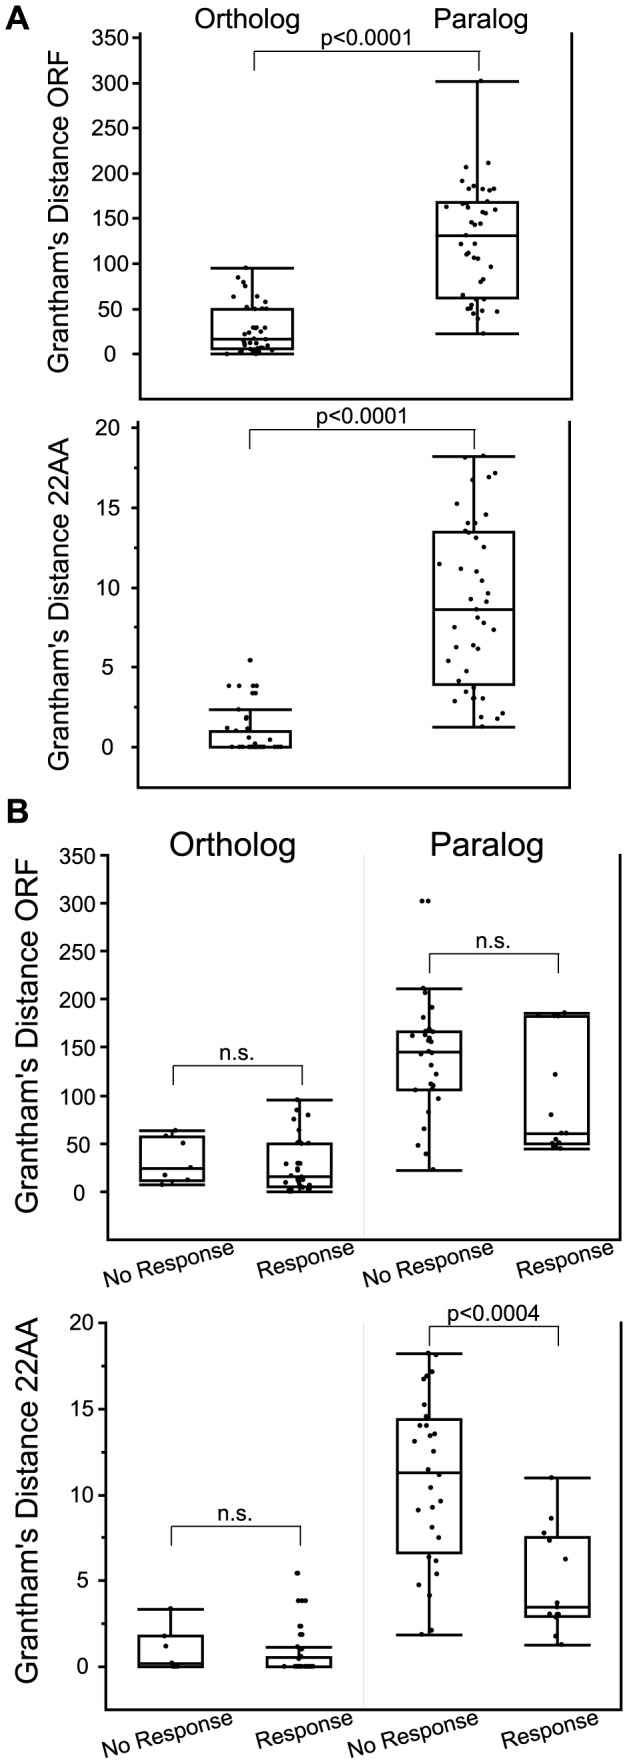
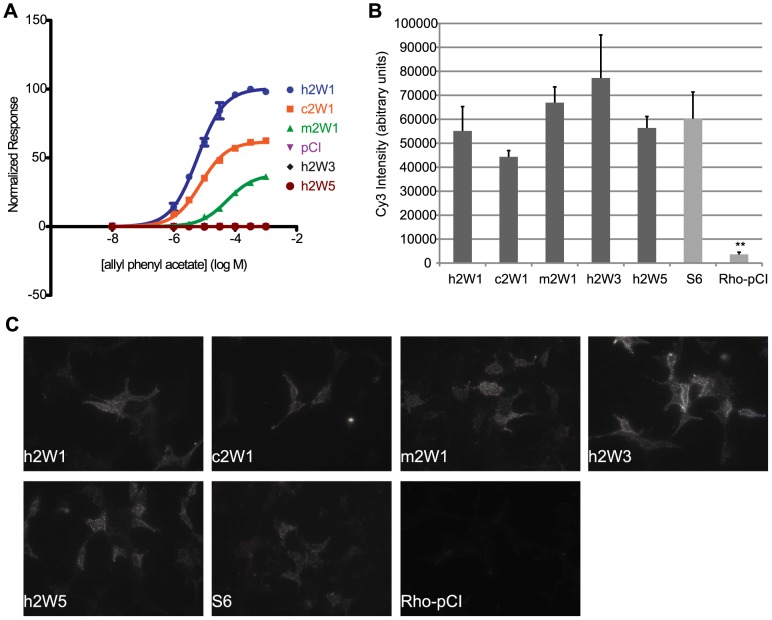
The mammalian odorant receptor (OR) repertoire is an attractive model to study evolution, because ORs have been subjected to rapid evolution between species, presumably caused by changes of the olfactory system to adapt to the environment. However, functional assessment of ORs in related species remains largely untested. Here we investigated the functional properties of primate and rodent ORs to determine how well evolutionary distance predicts functional characteristics. Using human and mouse ORs with previously identified ligands, we cloned 18 OR orthologs from chimpanzee and rhesus macaque and 17 mouse-rat orthologous pairs that are broadly representative of the OR repertoire. We functionally characterized the in vitro responses of ORs to a wide panel of odors and found similar ligand selectivity but dramatic differences in response magnitude. 87% of human-primate orthologs and 94% of mouse-rat orthologs showed differences in receptor potency (EC50) and/or efficacy (dynamic range) to an individual ligand. Notably dN/dS ratio, an indication of selective pressure during evolution, does not predict functional similarities between orthologs. Additionally, we found that orthologs responded to a common ligand 82% of the time, while human OR paralogs of the same subfamily responded to the common ligand only 33% of the time. Our results suggest that, while OR orthologs tend to show conserved ligand selectivity, their potency and/or efficacy dynamically change during evolution, even in closely related species. These functional changes in orthologs provide a platform for examining how the evolution of ORs can meet species-specific demands.


Conflict of interest statement

The authors have declared that no competing interests exist.

Figures

Figure 1
Figure 1. Distribution of primate and rodent OR orthologs with known ligands among OR classes and families.
(A) Unrooted tree of human ORs based on similarity of amino acid properties. 12 human-chimpanzee-rhesus macaque orthologs, 5 human-chimp orthologs and 1 human-macaque ortholog are highlighted in orange. (B) Unrooted tree of mouse ORs based on similarity of amino acid properties. 17 mouse-rat orthologs are highlighted in blue. Receptor similarity was quantified using Grantham's amino acid property scale .
Figure 2
Figure 2. Response of OR orthologs to 42 chemically diverse odors.
(A) Tuning curves of human, chimp and macaque OR2W1 orthologs tested against 42 odors using a cAMP-mediated luciferase assay . Odorants are ordered along the x-axis according to the response elicited from the human OR2W1, with the best ligands closer to the center. Y-axis represents the luciferase response to an odor at 100 µM (n = 3, ± S.E.). Negative values on the y-axis indicate the odor elicited an inhibitory response on OR signaling. See Figure S6 for additional tuning curves. (B) Response of chimp and macaque OR2W1 orthologs (variant responses) plotted against the human OR2W1 response using the data from (A). X-axis and y-axis are response in luciferase assay at 100 µM (n = 3, ± S.E.). The black line represents the unit-slope line. Odor abbreviations in Table S3.
Figure 3
Figure 3. Sequence similarity does not accurately predict the functional properties of ORs.
For each OR pair, the (A) Jukes-Cantor (nucleotide) distance (B) Grantham (amino acid) distance and (C) ω (dN/dS) is plotted against the functional distance, as defined by the correlation (1-R, Table S2) of the response across the 42-odor panel for ORs responding to more than three odors. ω values for human-chimp OR2W1 were included in the calculation but eliminated from the plot for better visual representation. Values closer to zero are more similar in sequence and function. Jukes-Cantor and ω do not correlate with functional distance (J-C rs = 0.14, p = 0.36; ω, rs = 0.18, p = 0.24) while Grantham's distance has a correlation to functional distance (rs = 0.38, p = 0.01).
Figure 4
Figure 4. Dose-response curves of an OR ortholog set to a given ligand.
(A) Primate OR2W1 orthologs to allyl phenyl acetate. (B) Primate OR10G7 orthologs to eugenol. (C) Primate OR8K3 orthologs to (+)-menthol. (D) Rodent 268-1 orthologs to 1-octanol. (E) Rodent 272-1 orthologs to (+)-carvone. X-axis is the concentration of a given odor in Log Molar. Y-axis is normalized response (n = 3, ± S.E.M.). Human (h), chimpanzee (c) and rhesus macaque (m) in primate ortholog sets; mouse (m) and rat (r) for rodent ortholog sets. Vector control is Rho-pCI. See Figure S9 for additional dose-response data.
Figure 5
Figure 5. Classification of functional changes in dose-response between orthologous OR pairs.
(A) human-chimp, (B) human-macaque, (C) chimp-macaque and (D) mouse-rat. Using both the potency (EC50) and efficacy (dynamic range) to a particular ligand, an orthologous pair is classified as either indistinguishable, hyper/hypo functional (one OR had both a lower potency and efficacy) or undefined (orthologs were significantly different but potency and efficacy did not change concordantly). Each pie chart refers to the first species in the comparison (e.g. (A) human is ___ to chimp). For visual explanation, see Figure S8.
Figure 6
Figure 6. Dose-response curves of OR orthologs and paralogs to a given ligand.
(A) OR5K1 orthologs and 5 K subfamily to eugenol methyl ether. (B) OR8D1 orthologs and 8D subfamily members to 4,5-dimethyl-3-hydroxy-2,5-dihydrofuran-2-one. (C) OR2J2 orthologs and 2J subfamily members to 1-octanol. X-axis is the concentration of a given odor in Log Molar. Y-axis is normalized response (n = 3, ± S.E.M.). Human (h), chimpanzee (c) and rhesus macaque (m), mouse receptors (m+number); para indicates a receptor that is a paralog to the human reference OR. Vector control is Rho-pCI. See Figure S11 for additional dose-response data from orthologs and subfamily members.
Figure 7
Figure 7. Comparison of amino acid similarity among orthologs and paralogs.
Grantham's distance was calculated for OR open reading frame (ORF) and for 22 predicted binding residues (22AA) used in Man et al. (2004) . (A) Orthologs are paralogs are significantly different using both ORF and 22AA (z = −6.61, p<0.0001 ORF; z = −7.35, p<0.0001 22AA, Wilcoxon Rank Sum). (B) Grantham's distance ORF and 22AA for orthologs and paralogs segregated by response to a common odor. Amino acid similarity of the 22 predicted binding residues (22AA) was significantly different for paralogs, with responding paralogs being more similar in sequence (z = −3.54, p<0.0004, Wilcoxon Rank Sum). n.s. is not significant. Box plots show minimum values,10% and 25% quantiles, median, 75% and 90% quantiles, and maximum values for each data set. Each ortholog and paralog is compared to the reference human OR in that group (listed first in Table S6).
Figure 8
Figure 8. Cell surface expression does not predict function of ORs.
(A) Primate OR2W1 orthologs and 2W subfamily members to allyl phenyl acetate. (B) Quantification of live cell-surface expression of each receptor. ** p<0.01 when compared to hOR2W1. Y-axis denotes the average Cy3 intensity in arbitrary units (a.u.) (n = 3, ± S.E.M.). S6 is positive control and Rho-pCI is negative control. (C) Representative image of live cell-surface staining for each receptor. For additional live-cell surface staining, see Figure S13, Table S7.

References

    1. Mombaerts P. Genes and ligands for odorant, vomeronasal and taste receptors. Nat Rev Neurosci. 2004;5:263–278. - PubMed
    1. Keller A, Vosshall LB. Better smelling through genetics: mammalian odor perception. Curr Opin Neurobiol. 2008;18:364–369. - PMC - PubMed
    1. Hayden S, Bekaert M, Crider TA, Mariani S, Murphy WJ, et al. Ecological adaptation determines functional mammalian olfactory subgenomes. Genome Res. 2010;20:1–9. - PMC - PubMed
    1. Koonin EV. Orthologs, paralogs, and evolutionary genomics. Annu Rev Genet. 2005;39:309–338. - PubMed
    1. Studer RA, Robinson-Rechavi M. How confident can we be that orthologs are similar, but paralogs differ? Trends Genet. 2009;25:210–216. - PubMed

Publication types