. 2012;7(7):e39744.
doi: 10.1371/journal.pone.0039744. Epub 2012 Jul 10.

Transcriptome changes affecting Hedgehog and cytokine signalling in the umbilical cord: implications for disease risk

Collaborators, Affiliations

Transcriptome changes affecting Hedgehog and cytokine signalling in the umbilical cord: implications for disease risk

Walter Stünkel et al. PLoS One. 2012.

Abstract

Background: Babies born at lower gestational ages or smaller birthweights have a greater risk of poorer health in later life. Both the causes of these sub-optimal birth outcomes and the mechanism by which the effects are transmitted over decades are the subject of extensive study. We investigated whether a transcriptomic signature of either birthweight or gestational age could be detected in umbilical cord RNA.

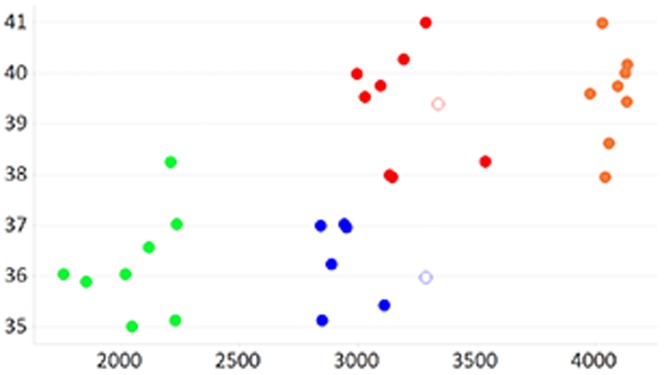
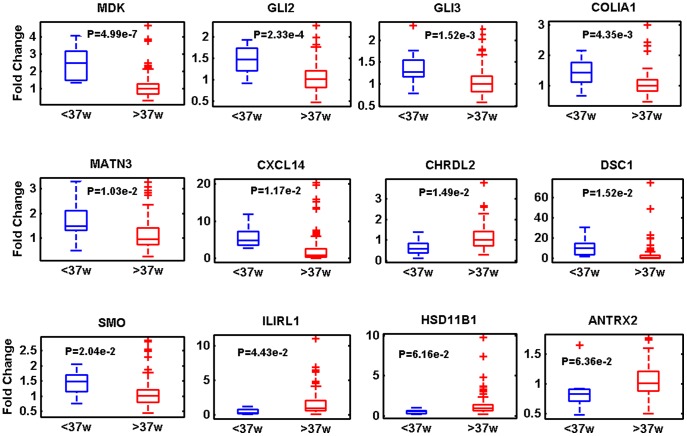
Methods: The gene expression patterns of 32 umbilical cords from Singaporean babies of Chinese ethnicity across a range of birthweights (1698-4151 g) and gestational ages (35-41 weeks) were determined. We confirmed the differential expression pattern by gestational age for 12 genes in a series of 127 umbilical cords of Chinese, Malay and Indian ethnicity.

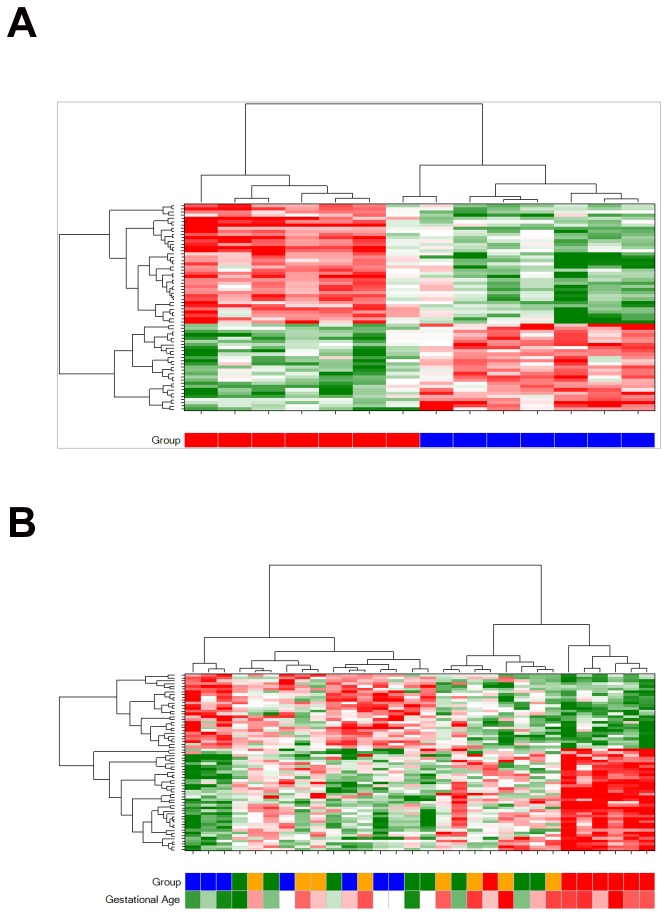
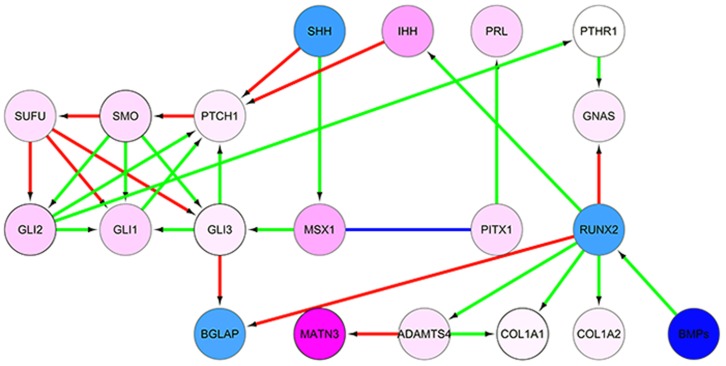
Results: We found that the transcriptome is substantially influenced by gestational age; but less so by birthweight. We show that some of the expression changes dependent on gestational age are enriched in signal transduction pathways, such as Hedgehog and in genes with roles in cytokine signalling and angiogenesis. We show that some of the gene expression changes we report are reflected in the epigenome.

Conclusions: We studied the umbilical cord which is peripheral to disease susceptible tissues. The results suggest that soma-wide transcriptome changes, preserved at the epigenetic level, may be a mechanism whereby birth outcomes are linked to the risk of adult metabolic and arthritic disease and suggest that greater attention be given to the association between premature birth and later disease risk.


Conflict of interest statement

Competing Interests: The authors have declared that no competing interests exist.

Figures

Figure 1
Figure 1. RNA Expression Microarray Study Design.
Gestational age in weeks (y-axis) and birth-weight in grams (x-axis) of the samples analysed by expression microarrays are symmetrical to allow somewhat independent comparisons for birth-weight and gestational age. Samples are classified into high birth weight group (>3700 g) in orange; low birthweight group (<2500 g) in green; normal birthweight and gestational age less than or equal to 37 weeks in blue; or normal birthweight and gestational age more than 37 weeks in red. Two samples that failed QC are shown as non-filled circles.
Figure 2
Figure 2. The largest source of variation in the transcriptomics data is associated with gestational age across samples.
Prinicipal component analysis using the RNA expression microarray data across just the normal birthweight samples (A) or across all samples (B), returned principal component 1 (x-axis) which has a significant correlation with gestational age of the samples. Samples are classified into high birth weight group (>3700 g) in orange; low birthweight group (<2500 g) in green; normal birthweight and gestational age less than or equal to 37 weeks in blue; or normal birthweight and gestational age more than 37 weeks in red.
Figure 3
Figure 3. Expression signature for gestational age organises samples into gestational age groups.
Hierarchical clustering of samples (columns) by the expression levels of the 64 probes (rows) significantly associated with gestational age (adjusted p-value<0.05), organises normal birth weight samples perfectly by gestational age group (A) and organises all samples into two clusters with significantly different gestational ages (B). Z-score normalised logged expression levels are denoted in the heat map (green for low, red for high, white for intermediate). X-axis colour bars denote sample classification: high birth weight group (>3700 g) in orange; low birthweight group (<2500 g) in green; normal birthweight and gestational age less than or equal to 37 weeks in blue; or normal birthweight and gestational age more than 37 weeks in red. Gestational age is also represented as a continuous variable in the x-axis colour bar in (B) green for low, red for high, white for intermediate.
Figure 4
Figure 4. Twelve transcripts have differential expression levels in gestational age groups across the 120 sample replication set.
Fold change with regard to the median sample of the more than 37 weeks gestation group, is shown on the y-axis. Gene names are shown above each panel. P-values from the 2 group tests are shown within each panel. Data is represented as a box plot where the 2–3 quartile range is within the box, the median is denoted by a horizontal line within the box, the min and max are denoted by horizontal lines outside of the box and single outliers are represented by crosses.
Figure 5
Figure 5. Subnetwork enriched for differential expression by gestational age.
Nodes represent genes and are coloured by the fold change of their transcripts by gestational age (blue for positive association with gestational age, pink for negative association). No probe for PTHR1 was included on the array. Arrows represent literature-verified interactions and the colours denote the type of interaction (green for activation, red for inhibition and blue for co-expression).

References

    1. Baird J, Kurshid MA, Kim M, Harvey N, Dennison E, et al. Does birthweight predict bone mass in adulthood? A systematic review and meta-analysis. Osteoporos Int. 2011;22:1323–1334. - PubMed
    1. Alisi A, Cianfarani S, Manco M, Agostoni C, Nobili V. Non-alcoholic fatty liver disease and metabolic syndrome in adolescents: Pathogenetic role of genetic background and intrauterine environment. Ann Med. 2011. - PubMed
    1. Leach L, Mann GE. Consequences of fetal programming for cardiovascular disease in adulthood. Microcirculation. 2011;18:253–255. - PubMed
    1. Painter RC, Osmond C, Gluckman P, Hanson M, Phillips DI, et al. Transgenerational effects of prenatal exposure to the Dutch famine on neonatal adiposity and health in later life. BJOG. 2008;115:1243–1249. - PubMed
    1. Sohi G, Revesz A, Hardy DB. Permanent implications of intrauterine growth restriction on cholesterol homeostasis. Semin Reprod Med. 2011;29:246–256. - PubMed

Publication types

MeSH terms

Associated data