. 2012;7(7):e39933.
doi: 10.1371/journal.pone.0039933. Epub 2012 Jul 10.

An improved genetically encoded red fluorescent Ca2+ indicator for detecting optically evoked action potentials

Affiliations

An improved genetically encoded red fluorescent Ca2+ indicator for detecting optically evoked action potentials

Masamichi Ohkura et al. PLoS One. 2012.

Abstract

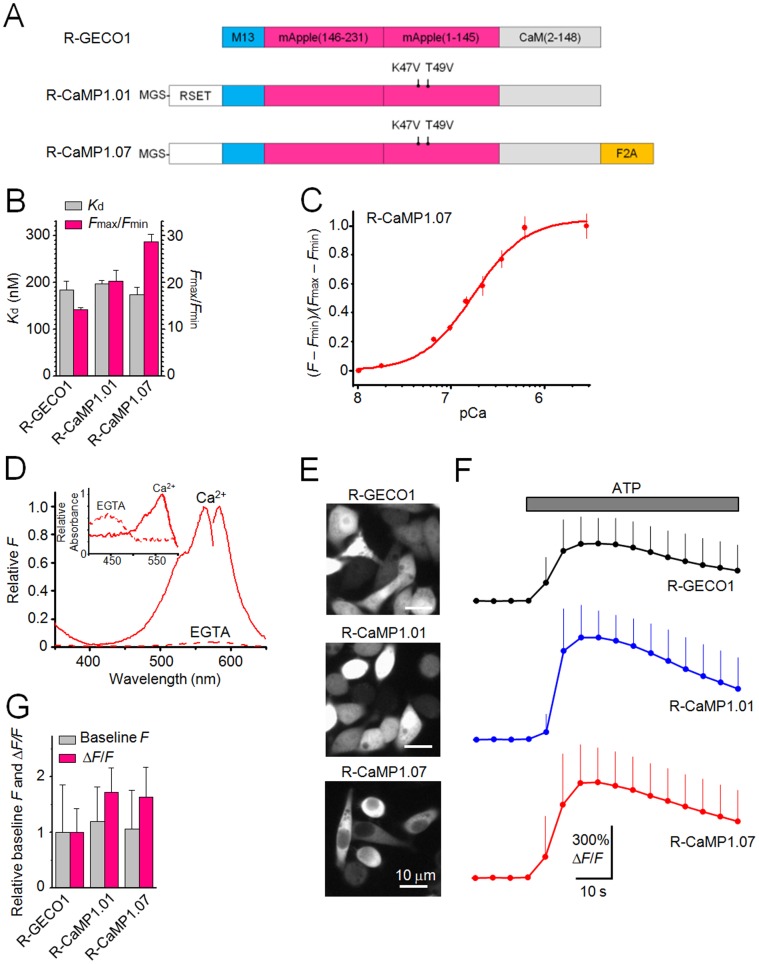
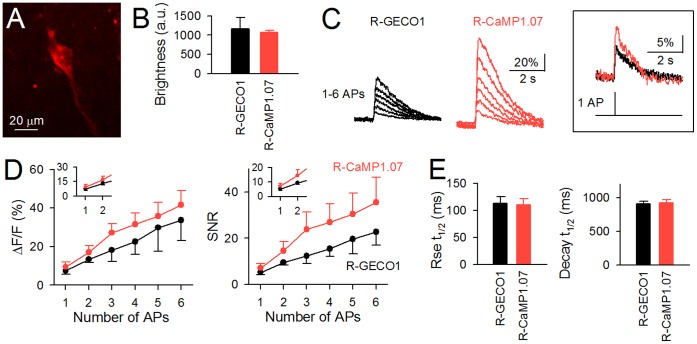
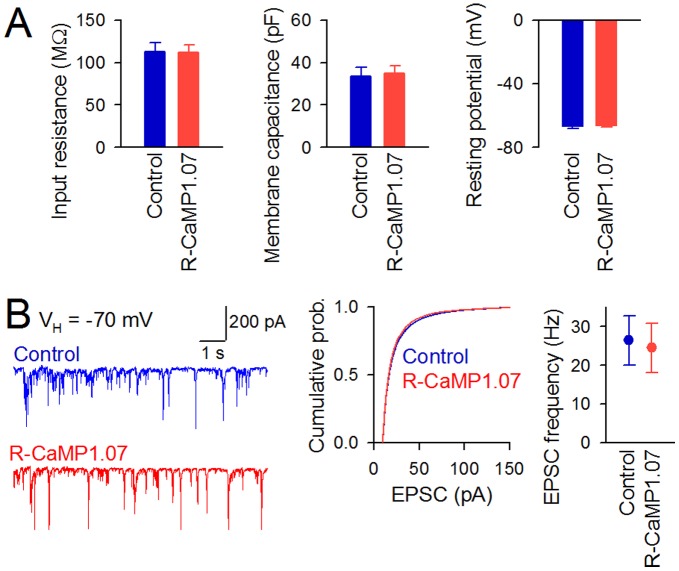
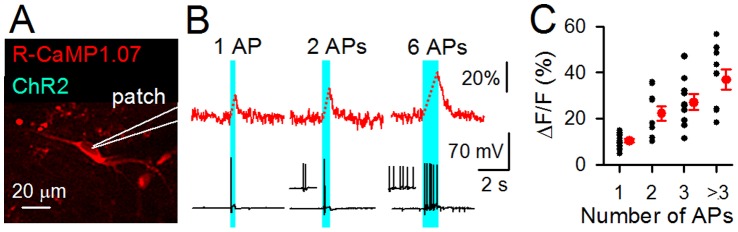
Genetically encoded Ca(2+) indicators (GECIs) are powerful tools to image activities of defined cell populations. Here, we developed an improved red fluorescent GECI, termed R-CaMP1.07, by mutagenizing R-GECO1. In HeLa cell assays, R-CaMP1.07 exhibited a 1.5-2-fold greater fluorescence response compared to R-GECO1. In hippocampal pyramidal neurons, R-CaMP1.07 detected Ca(2+) transients triggered by single action potentials (APs) with a probability of 95% and a signal-to-noise ratio >7 at a frame rate of 50 Hz. The amplitudes of Ca(2+) transients linearly correlated with the number of APs. The expression of R-CaMP1.07 did not significantly alter the electrophysiological properties or synaptic activity patterns. The co-expression of R-CaMP1.07 and channelrhodpsin-2 (ChR2), a photosensitive cation channel, in pyramidal neurons demonstrated that R-CaMP1.07 was applicable for the monitoring of Ca(2+) transients in response to optically evoked APs, because the excitation light for R-CaMP1.07 hardly activated ChR2. These technical advancements provide a novel strategy for monitoring and manipulating neuronal activity with single cell resolution.


Conflict of interest statement

Competing Interests: The authors have declared that no competing interests exist.

Figures

Figure 1
Figure 1. Characterization of R-CaMPs in vitro and in HeLa cells.
A, Schematic structures of R-CaMPs. Mutations are indicated with respect to R-GECO1. RSET and M13 are a tag that encodes hexahistidine and a target peptide for a Ca2+-bound CaM derived from MLCK, respectively. The amino-acid numbers of mApple and CaM are indicated in parentheses. B, Ca2+ affinity (K d) and dynamic range (F max/F min). Error bars, s.d. (n = 3 each). C, Ca2+ titration curve. Curves were fit according to the Hill equation. The K d is shown in B. Error bars, s.d. (n = 3 each). D, Normalized fluorescence and absorbance (inset) spectra of R-CaMP1.07 in 1 µM Ca2+ or 1 mM EGTA. E, Fluorescence images of HeLa cells expressing red fluorescent GECIs. F, Mean ΔF/F responses to the application of 100 µM ATP in HeLa cells. Error bars, s.d. (n = 163 cells for R-GECO1, 182 cells for R-CaMP1.01 and 166 cells for R-CaMP1.07). G, Baseline fluorescence and peak responses (ΔF/F) to the application of 100 µM ATP in HeLa cells. Error bars, s.d.
Figure 2
Figure 2. Comparison of the performance of R-GECO1 and R-CaMP1.07 in hippocampal pyramidal cells.
A, A confocal image showing a CA3 pyramidal cell expressing R-CaMP1.07 in a cultured slice. B, Mean fluorescent intensities of neurons expressing R-GECO1 and R-CaMP1.07. Error bars, s.e.m. (n = 6 cells each). P>0.05, Student’s t-test. C, Representative ΔF/F traces in response to trains of 1–6 APs delivered at 50 Hz for a pyramidal cell expressing R-GECO1 (left) and R-CaMP1.07 (right). The same traces for 1 AP are magnified in the right panel. D, Mean ΔF/F response and SNR plotted against the number of APs in R-GECO1 (black) and R-CaMP1.07 (red). Insets are magnified views of 1–2 APs. Error bars, s.e.m. (n = 5 cells each). E, The mean rise and decay time constant calculated from Ca2+ transients evoked by single APs. Error bars, s.e.m. (n = 5 cells each). P>0.05, Student’s t-test.
Figure 3
Figure 3. Electrophysiological properties of hippocampal neurons expressing R-CaMP1.07.
A, Average input resistance (left), membrane capacitance (middle), or resting potential (right) did not significantly differ between control and R-CaMP1.07 groups. Error bars, s.e.m. (n = 7 cells each). P>0.05, Student’s t-test. B, Representative spontaneous EPSCs recorded from a control and R-CaMP1.07-expressing cell at a holding potential of −70 mV (left). Cumulative probability of amplitudes of EPSCs is shown in the middle panel (Control, n = 11062 events; R-CaMP1.07, n = 10265 events). P>0.05, Kolmogorov-Smirnov test. Frequency of EPSCs is shown in the right panel. Error bars, s.e.m. (n = 7 cells each). P>0.05, Student’s t-test.
Figure 4
Figure 4. Simultaneous monitoring and manipulation of neuronal activity by co-expression of R-CaMP1.07 and ChR2.
A, A projection image of a CA3 pyramidal cell expressing R-CaMP1.07 and ChR2. The cell was whole-cell recorded to measure the number of APs. B, Imaging of ChR2-triggered-APs by changes in the R-CaMP1.07 fluorescence (top). APs were evoked by a pulse of 470-nm light with a duration of 300 to 3000 ms (blue region indicates time of photostimulation). Putative Ca2+ increases during the photostimulation are represented by broken lines (Bottom). The number of APs was recorded using the current-clamp mode. C, ΔF/F amplitude of the R-CaMP1.07 responses as a function of the number of APs induced by photostimulation. The peak ΔF/F amplitudes were calculated from the first frames after termination of the photostimulation. Individual data are plotted as black dots and their averages are shown in red. Error bars, s.e.m. (n = 4 cells).

References

    1. Palmer AE, Tsien RY. Measuring calcium signaling using genetically targetable fluorescent indicators. Nat Protoc. 2006;1:1057–1065. - PubMed
    1. Kotlikoff MI. Genetically encoded Ca2+ indicators: using genetics and molecular design to understand complex physiology. J Physiol. 2007;578:55–67. - PMC - PubMed
    1. Takahashi N, Oba S, Yukinawa N, Ujita S, Mizunuma M, et al. High-speed multineuron calcium imaging using Nipkow-type confocal microscopy. Curr Protoc Neurosci Chapter 2: Unit 2 14. 2011. - PubMed
    1. Shigetomi E, Kracun S, Sofroniew MV, Khakh BS. A genetically targeted optical sensor to monitor calcium signals in astrocyte processes. Nat Neurosci. 2010;13:759–766. - PMC - PubMed
    1. Mao T, O’Connor DH, Scheuss V, Nakai J, Svoboda K. Characterization and subcellular targeting of GCaMP-type genetically-encoded calcium indicators. PLoS One. 2008;3:e1796. - PMC - PubMed

Publication types

MeSH terms