

Pharmacokinetics and pharmacodynamics of the reverse transcriptase inhibitor tenofovir and prophylactic efficacy against HIV-1 infection
- PMID: 22808148
- PMCID: PMC3394807
- DOI: 10.1371/journal.pone.0040382
Pharmacokinetics and pharmacodynamics of the reverse transcriptase inhibitor tenofovir and prophylactic efficacy against HIV-1 infection
Erratum in
- PLoS One. 2012;7(11). doi:10.1371/annotation/fb73d0f4-1cd8-481d-bddd-20439896102a
Abstract
Antiviral pre-exposure prophylaxis (PrEP) through daily drug administration can protect healthy individuals from HIV-1 infection. While PrEP was recently approved by the FDA, the potential long-term consequences of PrEP implementation remain entirely unclear. The aim of this study is to predict the efficacy of different prophylactic strategies with the pro-drug tenofovir-disoproxil-fumarate (TDF) and to assess the sensitivity towards timing- and mode of TDF administration (daily- vs. single dose), adherence and the number of transmitted viruses. We developed a pharmacokinetic model for TDF and its active anabolite tenofovir-diphosphate (TFV-DP) and validated it with data from 4 different trials, including 4 distinct dosing regimes. Pharmacokinetics were coupled to an HIV model and viral decay following TDF mono-therapy was predicted, consistent with available data. Subsequently, a stochastic approach was used to estimate the % infections prevented by (i) daily TDF-based PrEP, (ii) one week TDF started either shortly before, or -after viral exposure and (iii) a single dose oral TDF before viral challenge (sd-PrEP). Analytical solutions were derived to assess the relation between intracellular TFV-DP concentrations and prophylactic efficacy. The predicted efficacy of TDF was limited by a slow accumulation of active compound (TFV-DP) and variable TFV-DP half-life and decreased with increasing numbers of transmitted viruses. Once daily TDF-based PrEP yielded [Formula: see text]80% protection, if at least 40% of pills were taken. Sd-PrEP with 300 mg or 600 mg TDF could prevent [Formula: see text]50% infections, when given at least before virus exposure. The efficacy dropped to [Formula: see text]10%, when given 1 h before 24 h exposure. Efficacy could not be increased with increasing dosage or prolonged administration. Post-exposure prophylaxis poorly prevented infection. The use of drugs that accumulate more rapidly, or local application of tenofovir gel may overcome the need for drug administration long before virus exposure.
Conflict of interest statement
Figures
 and
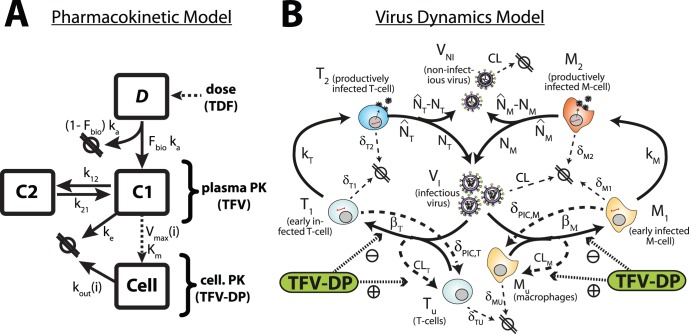
and  are the absorption and elimination rate constants of the central compartment C1 (which resembles plasma pharmacokinetics of TFV) respectively. The parameters
  and
and  denote the influx and outflux rate constant to-/from the peripheral compartment C2 respectively. Both compartments (central-/peripheral-) have the same volume of distribution
  . The dotted line from the central compartment to the intracellular compartment C3 represents subsumed processes, namely the cellular uptake of TFV and subsequent phosphorylation to TFV-DP, which were related to the plasma concentration of TFV (C1) by Michaelis-Menten kinetics, with parameters
  and individual parameter
  . The parameter
  is the individual, cellular elimination rate constant of TFV-DP. B: Virus dynamics model. T-cell and macrophage target cells (
 ,
,  ) can become successfully infected by infective virus
  with lumped infection rate constants
  and
and  , respectively, creating early infected cells
  and
and  . Infection can also be unsuccessful after the irreversible step of fusion (rate constant
  and
and  , dashed lines), eliminating the virus and rendering the cell uninfected. Early infected cells
  and
and  can destroy essential viral proteins or DNA prior to integration with rate constants
  and
and  (dashed lines) returning the cell to an uninfected stage. The genomic viral DNA can become integrated with rate constants
  and
and  creating late infected cells
  and
and  , which can release new infectious- and non infectious virus
  and
and  with rate constants
  and
and  , respectively. All cellular compartments
  can get destroyed by the immune system with respective rate constants
  and the free virus gets cleared with rate constant
  (thin dashed lines). The pharmacologically active form of tenofovir (tenofovir-diphosphate, TFV-DP, green box) inhibits successful cell-infection (parameter
  ) and increases the rate of unsuccessful infection (parameter
  ).
).
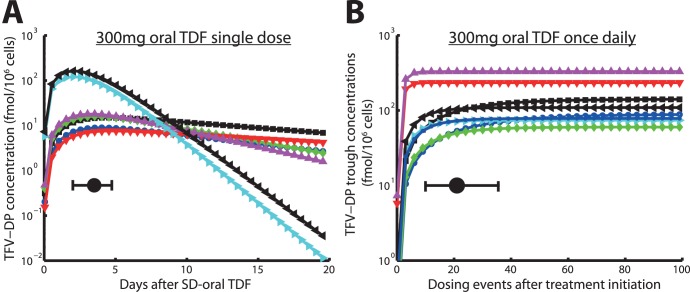
 value and its range. B: Trough levels of TFV-DP in PBMCs following 300 mg oral TDF every 24hours, indicating the accumulation of active compound. The solid black circle and the horizontal error bar indicate the time until plateau concentrations are reached and the range for this parameter. Blue cirles, black squares, green diamonds, red downward pointing triangles, magenta upward-pointing triangles, cyan right-ward pointing triangles, black left-pointing triangles and blue asterisks indicate individual predictions for 8 patients.
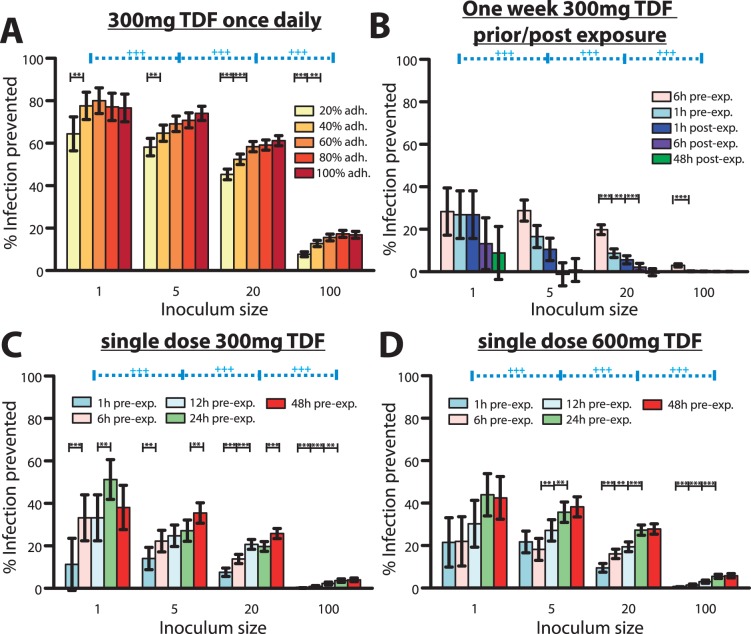
 prophylactic efficacy depends on adherence at the p
  0.05 or p
  0.01 level respectively. B: Predicted % infections prevented by a one week 300 mg TDF (1w-PrEP/PEP) when started at distinct times before/after exposure with distinct numbers of viruses.
  prophylactic efficacy depends on the timing of start of TDF administration at the p
  0.05 or p
  0.01 level respectively. C: Predicted % infections prevented by a single dose 300 mg TDF (sd-PrEP) when taken at distinct times before exposure with distinct virus inoculum sizes.
  prophylactic efficacy depends on the timing of TDF single dose administration at the p
  0.05 or p
  0.01 level respectively. D: Predicted % infections prevented by a single dose 600 mg TDF (sd-PrEP) when taken at distinct times before exposure with distinct virus inoculum sizes. Error bars represent confidence bounds calculated using Greenwood’s formula.
  prophylactic efficacy depends on the inoculum size. The predicted probability of infection in the absence of drugs
  was
was  ,
,  ,
,  and
and  when
when  = 1, 5, 20 or 100, respectively, viruses were inoculated.
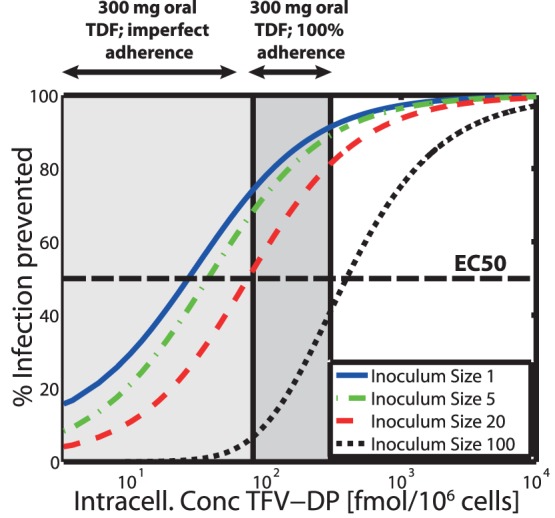
 ). The dark grey area indicates the TFV-DP concentration range achieved during once daily 300 mg oral TDF dosing with 100% adherence, whereas the light grey extension to the left indicates the range of concentrations resulting from imperfect adherence. Predictions are based on the approximate analytic solution derived in Text S2.
Similar articles
-
Natural substrate concentrations can modulate the prophylactic efficacy of nucleotide HIV reverse transcriptase inhibitors.J Virol. 2011 Jul;85(13):6610-7. doi: 10.1128/JVI.00311-11. Epub 2011 Apr 27. J Virol. 2011. PMID: 21525346 Free PMC article.
-
Pharmacokinetics of antiretroviral regimens containing tenofovir disoproxil fumarate and atazanavir-ritonavir in adolescents and young adults with human immunodeficiency virus infection.Antimicrob Agents Chemother. 2008 Feb;52(2):631-7. doi: 10.1128/AAC.00761-07. Epub 2007 Nov 19. Antimicrob Agents Chemother. 2008. PMID: 18025112 Free PMC article.
-
Pilot pharmacokinetic study of human immunodeficiency virus-infected patients receiving tenofovir disoproxil fumarate (TDF): investigation of systemic and intracellular interactions between TDF and abacavir, lamivudine, or lopinavir-ritonavir.Antimicrob Agents Chemother. 2009 May;53(5):1937-43. doi: 10.1128/AAC.01064-08. Epub 2009 Mar 9. Antimicrob Agents Chemother. 2009. PMID: 19273671 Free PMC article. Clinical Trial.
-
Emtricitabine/tenofovir disoproxil fumarate: a review of its use in HIV-1 pre-exposure prophylaxis.Drugs. 2013 Mar;73(3):279-91. doi: 10.1007/s40265-013-0024-4. Drugs. 2013. PMID: 23444256 Review.
-
Tenofovir-based pre-exposure prophylaxis for HIV prevention: evolving evidence.Curr Opin Infect Dis. 2012 Feb;25(1):51-7. doi: 10.1097/QCO.0b013e32834ef5ef. Curr Opin Infect Dis. 2012. PMID: 22156901 Free PMC article. Review.
Cited by
-
Assessment of Demographic and Socio-Behavioral Factors on Adherence to HIV Pre-Exposure Prophylaxis Using a Markov Modeling Approach.Front Pharmacol. 2019 Jul 12;10:785. doi: 10.3389/fphar.2019.00785. eCollection 2019. Front Pharmacol. 2019. PMID: 31354496 Free PMC article.
-
Model Linking Plasma and Intracellular Tenofovir/Emtricitabine with Deoxynucleoside Triphosphates.PLoS One. 2016 Nov 10;11(11):e0165505. doi: 10.1371/journal.pone.0165505. eCollection 2016. PLoS One. 2016. PMID: 27832147 Free PMC article.
-
Pharmacologic Considerations for Preexposure Prophylaxis in Transgender Women.J Acquir Immune Defic Syndr. 2016 Aug 15;72 Suppl 3(Suppl 3):S230-4. doi: 10.1097/QAI.0000000000001105. J Acquir Immune Defic Syndr. 2016. PMID: 27429188 Free PMC article. Review.
-
Preclinical Considerations for Long-acting Delivery of Tenofovir Alafenamide from Subdermal Implants for HIV Pre-exposure Prophylaxis.Pharm Res. 2023 Jul;40(7):1657-1672. doi: 10.1007/s11095-022-03440-6. Epub 2022 Nov 23. Pharm Res. 2023. PMID: 36418671 Free PMC article.
-
Modelling the impact of initiation delay, duration and prior PrEP on the efficacy of post-exposure prophylaxis containing a tenofovir/emtricitabine backbone.J Int AIDS Soc. 2025 Jun;28 Suppl 1(Suppl 1):e26454. doi: 10.1002/jia2.26454. J Int AIDS Soc. 2025. PMID: 40569890 Free PMC article.
References
-
- Chapman T, McGavin J, Noble S. Tenofovir disoproxil fumarate. Drugs. 2003;63:1597–1608. - PubMed
-
- National Institute of Health (NIH). Accessed: 27 Feb. 2012. Current HIV treatment guidelines: Available: http://www.aidsinfo.nih.gov/guidelines/.
-
- Naesens L, Balzarini J, Bischofberger N, Clercq ED. Antiretroviral activity and pharmacokinetics in mice of oral bis(pivaloyloxymethyl)-9-(2- phosphonylmethoxyethyl)adenine, the bis(pivaloyloxymethyl) ester prodrug of 9-(2- phosphonylmethoxyethyl)adenine. Antimicrob Agents Chemother. 1996;40:22–28. - PMC - PubMed
-
- Kearney BP, Flaherty JF, Shah J. Tenofovir disoproxil fumarate: clinical pharmacology and pharmacokinetics. Clin Pharmacokinet. 2004;43:595–612. - PubMed
Publication types
MeSH terms
Substances
LinkOut - more resources
Full Text Sources
Other Literature Sources
Medical
Miscellaneous
