. 2012;7(7):e40617.
doi: 10.1371/journal.pone.0040617. Epub 2012 Jul 11.

The role of nuclear matrix proteins binding to matrix attachment regions (Mars) in prostate cancer cell differentiation

Affiliations

The role of nuclear matrix proteins binding to matrix attachment regions (Mars) in prostate cancer cell differentiation

Paola Barboro et al. PLoS One. 2012.

Abstract

In tumor progression definite alterations in nuclear matrix (NM) protein composition as well as in chromatin structure occur. The NM interacts with chromatin via specialized DNA sequences called matrix attachment regions (MARs). In the present study, using a proteomic approach along with a two-dimensional Southwestern assay and confocal laser microscopy, we show that the differentiation of stabilized human prostate carcinoma cells is marked out by modifications both NM protein composition and bond between NM proteins and MARs. Well-differentiated androgen-responsive and slowly growing LNCaP cells are characterized by a less complex pattern and by a major number of proteins binding MAR sequences in comparison to 22Rv1 cells expressing androgen receptor but androgen-independent. Finally, in the poorly differentiated and strongly aggressive androgen-independent PC3 cells the complexity of NM pattern further increases and a minor number of proteins bind the MARs. Furthermore, in this cell line with respect to LNCaP cells, these changes are synchronous with modifications in both the nuclear distribution of the MAR sequences and in the average loop dimensions that significantly increase. Although the expression of many NM proteins changes during dedifferentiation, only a very limited group of MAR-binding proteins seem to play a key role in this process. Variations in the expression of poly (ADP-ribose) polymerase (PARP) and special AT-rich sequence-binding protein-1 (SATB1) along with an increase in the phosphorylation of lamin B represent changes that might trigger passage towards a more aggressive phenotype. These results suggest that elucidating the MAR-binding proteins that are involved in the differentiation of prostate cancer cells could be an important tool to improve our understanding of this carcinogenesis process, and they could also be novel targets for prostate cancer therapy.


Conflict of interest statement

Competing Interests: The authors have declared that no competing interests exist.

Figures

Figure 1
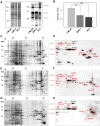
Figure 1. NM proteins binding the XmnI sequence in PCa cell lines.
(A) Representative Deep Purple-stained 1D gel and the corresponding SWB. The arrows on the right indicate the three principal bands arising in 1D SWB, each of which corresponds to several spots in 2D as evident in (D), (F) and (H). (B) The comparison between the relative quantity of XmnI binding to NM proteins in the different cell lines. Ordinate represents the mean±SE of the relative amounts of XmnI as determined by quantitative analysis of three different preparations. The decrease in 22Rv1 and PC3 with respect LNCaP cells was significant (*P = 0.004, **P<10−5). (C, E and G) Representative 2D silver-stained gel maps and (D, F and H) SWB of NM proteins extracted from LNCaP (C, D), 22Rv1 (E, F) and PC3 (G, H) cells. The proteins identified are highlighted in red boxes. The three arrows show the three groups of proteins pointed out in (A). L, lamin; h, hnRNP, fr, fragments.
Figure 2
Figure 2. Analysis of the differentially expressed NM proteins in LNCaP, 22Rv1 and PC3 cells.
(A) Venn diagram showing the number of protein spots visualized in each cell line. Numbers in the overlapping regions represent common spots. (B–D) Pie charts showing the percentage of spots that bind the XmnI sequence in three cell lines. The colors cyan and yellow, denote the spots that were, with respect LNCaP cells, differently expressed or with no difference, in 22Rv1 (C) or PC3 (D), respectively.
Figure 3
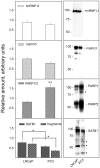
Figure 3. Expression levels of hnRNP U, Matrin3, PARP and SATB1 in LNCaP and PC3 cells.
The ordinates represent the mean±SE of the relative amounts of these proteins as determined by quantitative analysis of three to six WBs carried out utilizing at least three different preparation of NM (*P≤0.05; **P<0.0005). Representative WBs are shown on the right; the major proteolytic fragments of PARP1 and SATB1 are marked by full dots. The relative molecular weights of standard proteins in kDa are reported.
Figure 4
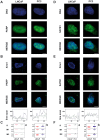
Figure 4. Spatial distribution of PARP and SATB1 in relation to DNA or XmnIsequence.
(A, D) Whole cells stained by dual-color immunofluorescence. (B, E) NM prepared in situ and stained by immuno-FISH. (A, B) Confocal microscope analysis of the localization of PARP (green) and DNA or XmnI sequence (blue). (D, E) Localization of SATB1 (green) and DNA or XmnI sequence (blue). In the bottom of panels B and E the intensity profile line scans, performed between the white crosses of the NM as indicated on confocal merge images in B and E, are shown. The ordinate represents the fluorescence intensity in arbitrary units, the abscissa represents the distance in pixels. The bars correspond to 5 µm. (C, F) Scatter plots showing quantification analyses of the colocalization of PARP/DNA (a), PARP/XmnI (b), SATB1/DNA (a), or SATB1/XmnI (b), respectively. R corresponds to Pearson’s correlation coefficient; M1 to the fraction of protein being studied overlapping the DNA or XmnI and M2 the fraction of DNA or XmnI overlapping the protein. Horizontal lines show the mean values±SE of 20 fields (122–226 total NMs) replicated in two different experiments (*P≤0.03, **P<0.001).
Figure 5
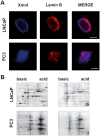
Figure 5. Spatial distribution and phosphorylation level of lamin B in the NM.
(A) Representative confocal microscope images of lamin B (red) and XmnI sequence (blue) in the NM extracted in situ and stained by immuno-FISH. The bars correspond to 5 µm. (B) Magnified section of 2D-PAGE stained with SYPRO Ruby (a, c) or Pro-Q Diamond that selectively stains only phosphoproteins (b, d). The arrowheads indicate the various isoforms of lamin B. The same color corresponds to the same isoform in two cell lines. In PC3 cells, the non-phosphorylated peptide present in LNCaP cells disappeared (red arrowheads).
Figure 6
Figure 6. DNA loop organization in LNCaP and PC3 cells.
(A) Representative nucleoids stained either by DAPI (blue) to visualize only total DNA (left panels) or by halo-FISH to highlight the XmnI sequence (red) and counterstained with DAPI to detect total DNA (blue).The bar corresponds to 10 µm. (B) Scatter plot showing the distribution of DNA halo size. Horizontal lines indicate the mean values obtained measuring for each cell line at least 100 nucleoids. The average DNA halo size ± SE was 6.8±0.2 for LNCaP cells and 7.5±0.2 for PC3 cells, respectively (P = 0.009). The bottom panel shows the frequency distribution of the halo radii grouped in intervals of 2 µm. (C) A schematic model of the interrelationship between the loops and the NM in the dedifferentiation of PCa cells. In more-differentiated cells (LNCaP) the NM is well organized with several proteins bound to MAR sequences. In PC3, where some structural regularities of the NM disappear, a smaller number of protein species bound the MARs and so a larger DNA loop is anchored to the NM.

References

    1. Lever E, Sheer D. The role of nuclear organization in cancer. J Pathol. 2010;220:114–125. - PubMed
    1. Gluch A, Vidakovic M, Bode J. Scaffold/matrix attachment regions (S/MARs): relevance for disease and therapy. Handb Exp Pharmacol. 2008;186:67–103. - PubMed
    1. Razin SV. The nuclear matrix and chromosomal DNA loops: is their any correlation between partitioning of the genome into loops and functional domains? Cell Mol Biol Lett. 2001;6:59–69. - PubMed
    1. Barboro P, D’Arrigo C, Repaci E, Bagnasco L, Orecchia P, et al. Proteomic analysis of the nuclear matrix in the early stages of rat liver carcinogenesis: identification of differentially expressed and MAR-binding proteins. Exp Cell Res. 2009;315:226–239. - PubMed
    1. Barboro P, D’Arrigo C, Repaci E, Patrone E, Balbi C. Organization of the lamin scaffold in the internal nuclear matrix of normal and transformed hepatocytes. Exp Cell Res. 2010;316:992–1001. - PubMed

Publication types

MeSH terms

Substances