

Sleep phenotyping in a mouse model of extreme trait anxiety
- PMID: 22808211
- PMCID: PMC3394752
- DOI: 10.1371/journal.pone.0040625
Sleep phenotyping in a mouse model of extreme trait anxiety
Abstract
Background: There is accumulating evidence that anxiety impairs sleep. However, due to high sleep variability in anxiety disorders, it has been difficult to state particular changes in sleep parameters caused by anxiety. Sleep profiling in an animal model with extremely high vs. low levels of trait anxiety might serve to further define sleep patterns associated with this psychopathology.
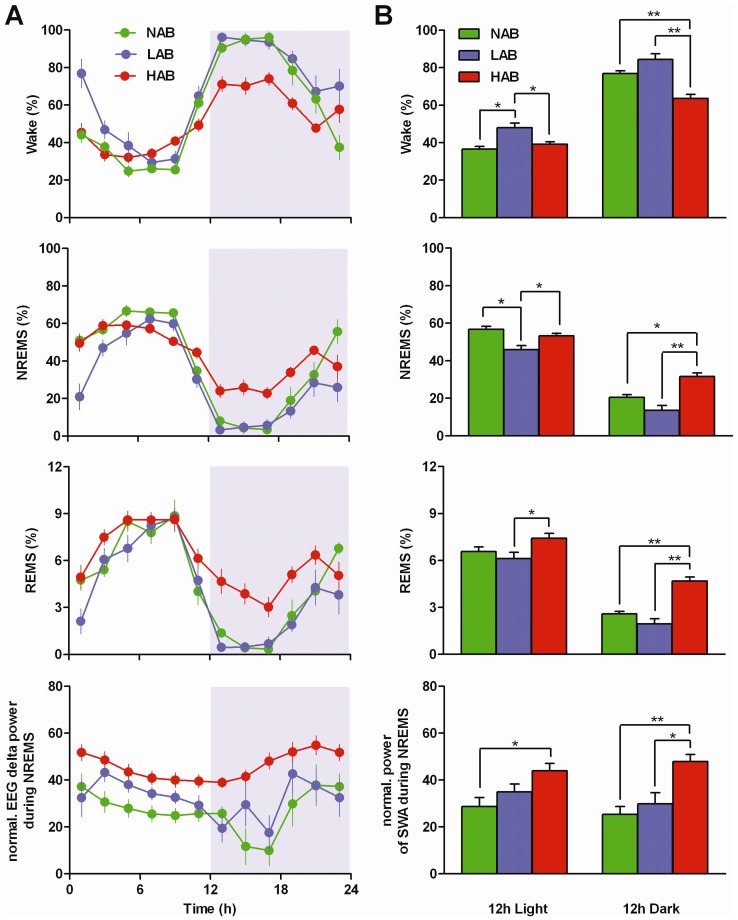
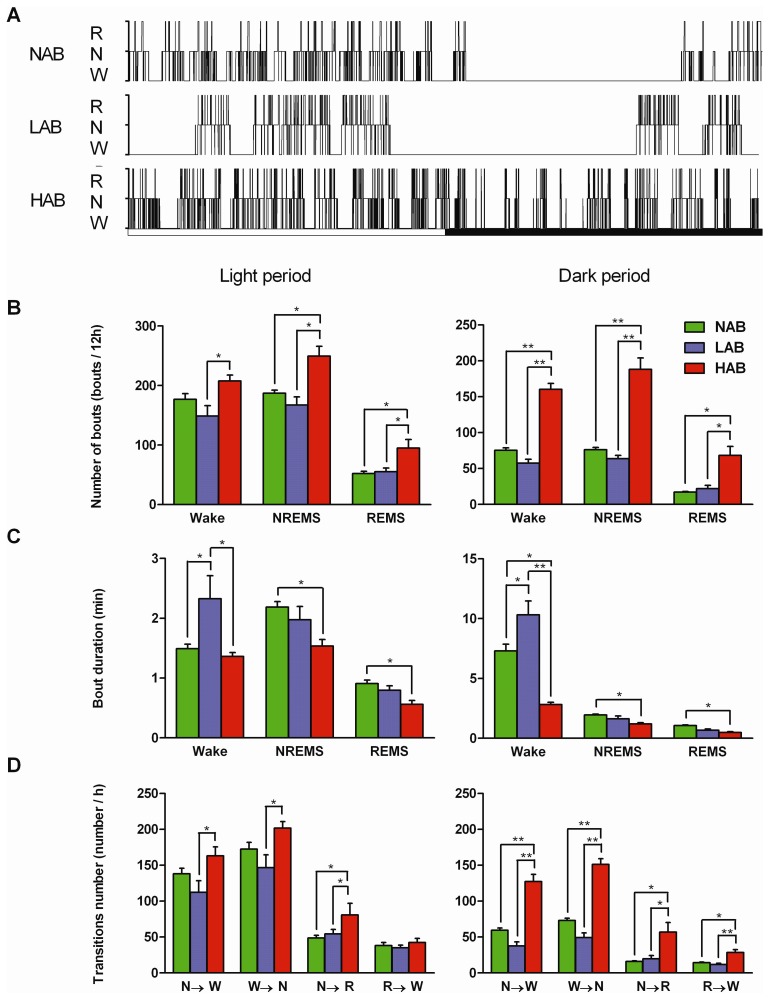
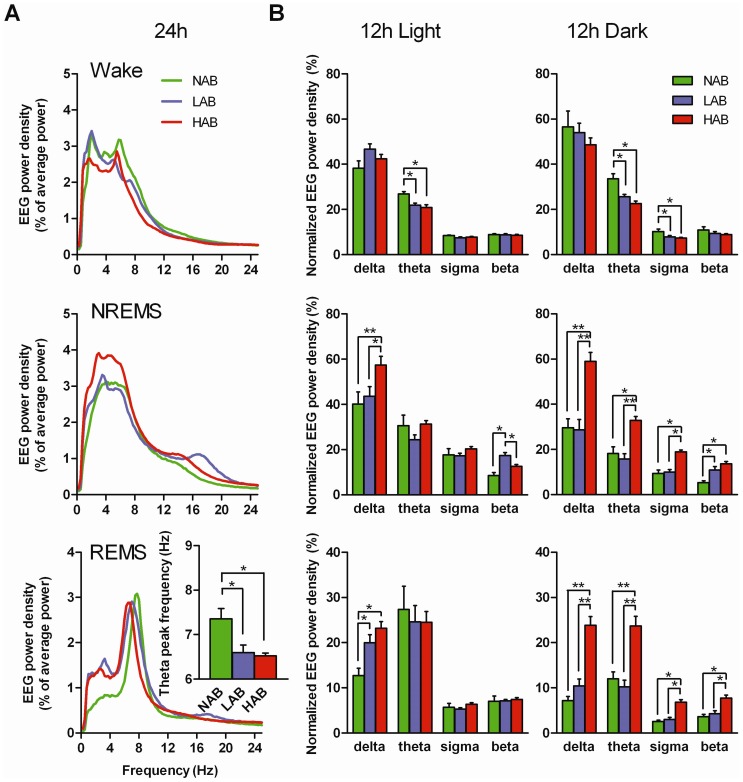
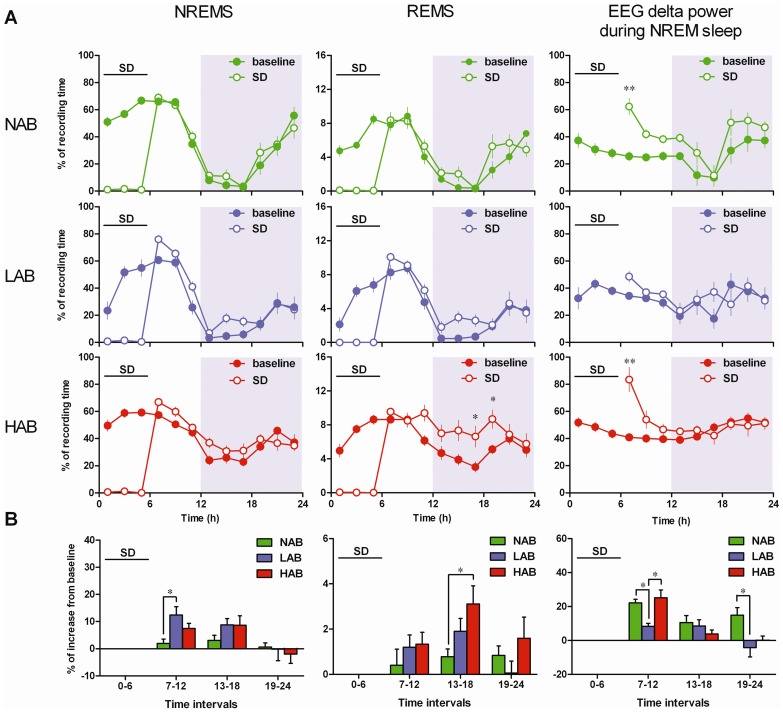
Methodology/principal findings: Sleep-wake behavior in mouse lines with high (HAB), low (LAB) and normal (NAB) anxiety-related behaviors was monitored for 24 h during baseline and recovery after 6 h sleep deprivation (SD). The amounts of each vigilance state, sleep architecture, and EEG spectral variations were compared between the mouse lines. In comparison to NAB mice, HAB mice slept more and exhibited consistently increased delta power during non-rapid eye movement (NREM) sleep. Their sleep patterns were characterized by heavy fragmentation, reduced maintenance of wakefulness, and frequent intrusions of rapid eye movement (REM) sleep. In contrast, LAB mice showed a robust sleep-wake rhythm with remarkably prolonged sleep latency and a long, persistent period of wakefulness. In addition, the accumulation of delta power after SD was impaired in the LAB line, as compared to HAB mice.
Conclusions/significance: Sleep-wake patterns were significantly different between HAB and LAB mice, indicating that the genetic predisposition to extremes in trait anxiety leaves a biological scar on sleep quality. The enhanced sleep demand observed in HAB mice, with a strong drive toward REM sleep, may resemble a unique phenotype reflecting not only elevated anxiety but also a depression-like attribute.
Conflict of interest statement
Figures
Similar articles
-
Behavioral sleep-wake homeostasis and EEG delta power are decoupled by chronic sleep restriction in the rat.Sleep. 2015 May 1;38(5):685-97. doi: 10.5665/sleep.4656. Sleep. 2015. PMID: 25669184 Free PMC article.
-
NREM sleep hypersomnia and reduced sleep/wake continuity in a neuroendocrine mouse model of anxiety/depression based on chronic corticosterone administration.Neuroscience. 2014 Aug 22;274:357-68. doi: 10.1016/j.neuroscience.2014.05.050. Epub 2014 Jun 6. Neuroscience. 2014. PMID: 24909899
-
Pharmacological Modulation of Sleep Homeostasis in Rat: Novel Effects of an mGluR2/3 Antagonist.Sleep. 2019 Sep 6;42(9):zsz123. doi: 10.1093/sleep/zsz123. Sleep. 2019. PMID: 31106825
-
Selective breeding of rats for high (HAB) and low (LAB) anxiety-related behaviour: A unique model for comorbid depression and social dysfunctions.Neurosci Biobehav Rev. 2023 Sep;152:105292. doi: 10.1016/j.neubiorev.2023.105292. Epub 2023 Jun 22. Neurosci Biobehav Rev. 2023. PMID: 37353047 Review.
-
Sleep and obesity: a focus on animal models.Neurosci Biobehav Rev. 2012 Mar;36(3):1015-29. doi: 10.1016/j.neubiorev.2012.01.001. Epub 2012 Jan 16. Neurosci Biobehav Rev. 2012. PMID: 22266350 Free PMC article. Review.
Cited by
-
Neuropeptide S Counteracts Paradoxical Sleep Deprivation-Induced Anxiety-Like Behavior and Sleep Disturbances.Front Cell Neurosci. 2018 Mar 6;12:64. doi: 10.3389/fncel.2018.00064. eCollection 2018. Front Cell Neurosci. 2018. PMID: 29559896 Free PMC article.
-
A simplified microwave-based motion detector for home cage activity monitoring in mice.J Biol Eng. 2017 Nov 16;11:36. doi: 10.1186/s13036-017-0079-y. eCollection 2017. J Biol Eng. 2017. PMID: 29177007 Free PMC article.
-
Technology of the photobiostimulation of the brain's drainage system during sleep for improvement of learning and memory in male mice.Biomed Opt Express. 2023 Dec 5;15(1):44-58. doi: 10.1364/BOE.505618. eCollection 2024 Jan 1. Biomed Opt Express. 2023. PMID: 38223185 Free PMC article.
-
Hydrogen-rich water improves sleep consolidation and enhances forebrain neuronal activation in mice.Sleep Adv. 2023 Dec 30;5(1):zpad057. doi: 10.1093/sleepadvances/zpad057. eCollection 2024. Sleep Adv. 2023. PMID: 38264142 Free PMC article.
-
Analyzing gene expression data in mice with the Neuro Behavior Ontology.Mamm Genome. 2014 Feb;25(1-2):32-40. doi: 10.1007/s00335-013-9481-z. Epub 2013 Nov 1. Mamm Genome. 2014. PMID: 24177753
References
-
- Wong ML, Licinio J. From monoamines to genomic targets: a paradigm shift for drug discovery in depression. Nat Rev Drug Discov. 2004;3:136–151. - PubMed
-
- Benca RM, Okawa M, Uchiyama M, Ozaki S, Nakajima T, et al. Sleep and mood disorders. Sleep Med Rev. 1997;1:45–56. - PubMed
-
- Steiger A, Kimura M. Wake and sleep EEG provide biomarkers in depression. J Psychiatr Res. 2009;44:242–252. - PubMed
-
- Tsuno N, Besset A, Ritchie K. Sleep and depression. J Clin Psychiatry. 2005;66:1254–1269. - PubMed
-
- Baldwin DS, Papakostas GI. Symptoms of fatigue and sleepiness in major depressive disorder. J Clin Psychiatry. 2006;67:9–15. - PubMed
Publication types
MeSH terms
LinkOut - more resources
Full Text Sources
Medical
Molecular Biology Databases
Miscellaneous
