. 2012;7(7):e40735.
doi: 10.1371/journal.pone.0040735. Epub 2012 Jul 12.

Developmental gene expression profiling along the tonotopic axis of the mouse cochlea

Affiliations

Developmental gene expression profiling along the tonotopic axis of the mouse cochlea

Eun Jin Son et al. PLoS One. 2012.

Abstract

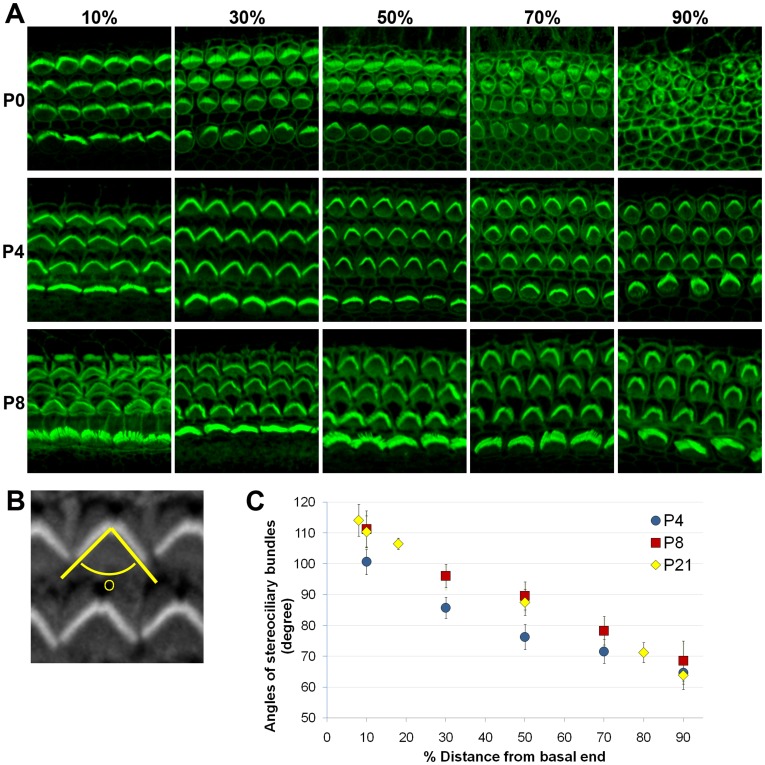
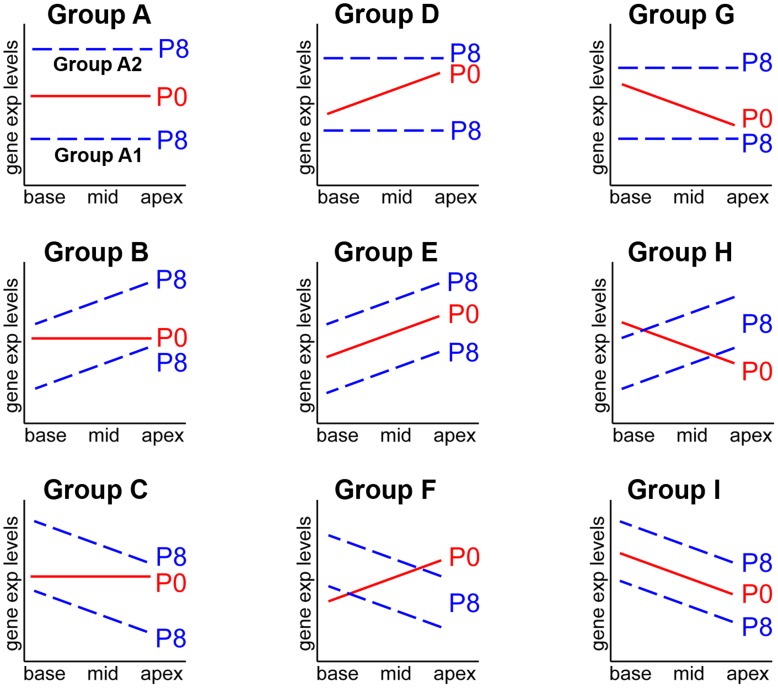
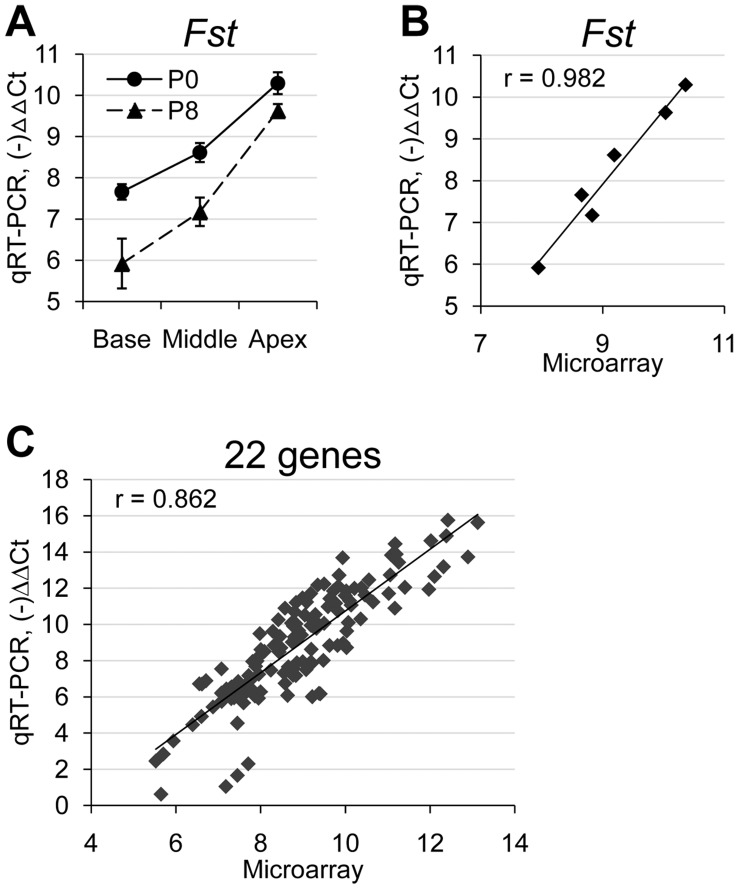
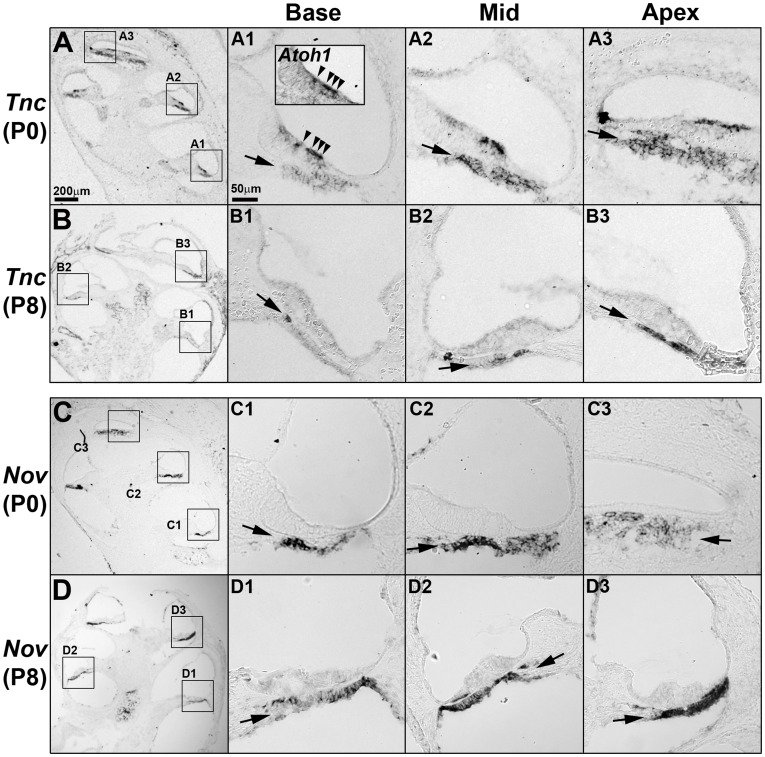
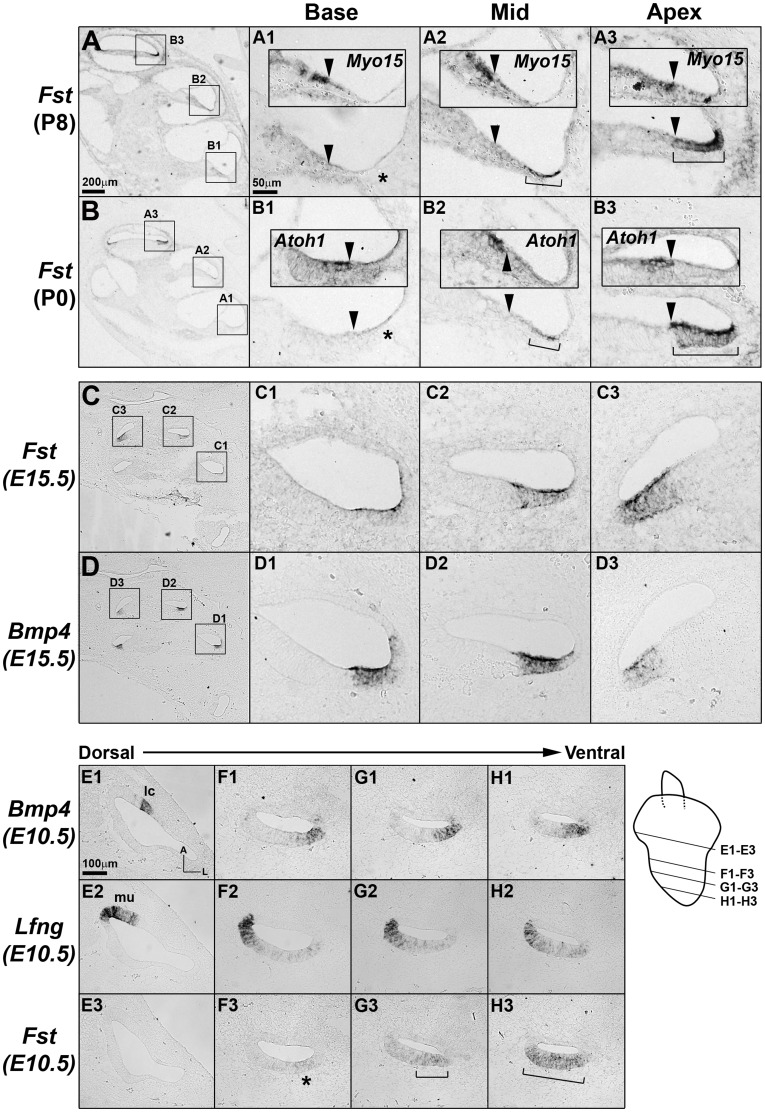
The mammalian cochlear duct is tonotopically organized such that the basal cochlea is tuned to high frequency sounds and the apical cochlea to low frequency sounds. In an effort to understand how this tonotopic organization is established, we searched for genes that are differentially expressed along the tonotopic axis during neonatal development. Cochlear tissues dissected from P0 and P8 mice were divided into three equal pieces, representing the base, middle and apex, and gene expression profiles were determined using the microarray technique. The gene expression profiles were grouped according to changes in expression levels along the tonotopic axis as well as changes during neonatal development. The classified groups were further analyzed by functional annotation clustering analysis to determine whether genes associated with specific biological function or processes are particularly enriched in each group. These analyses identified several candidate genes that may be involved in cochlear development and acquisition of tonotopy. We examined the expression domains for a few candidate genes in the developing mouse cochlea. Tnc (tenacin C) and Nov (nephroblastoma overexpressed gene) are expressed in the basilar membrane, with increased expression toward the apex, which may contribute to graded changes in the structure of the basilar membrane along the tonotopic axis. In addition, Fst (Follistatin), an antagonist of TGF-β/BMP signaling, is expressed in the lesser epithelial ridge and at gradually higher levels towards the apex. The graded expression pattern of Fst is established at the time of cochlear specification and maintained throughout embryonic and postnatal development, suggesting its possible role in the organization of tonotopy. Our data will provide a good resource for investigating the developmental mechanisms of the mammalian cochlea including the acquisition of tonotopy.


Conflict of interest statement

Competing Interests: The authors have declared that no competing interests exist.

Figures

Figure 1
Figure 1. Maturation of hair cells during neonatal cochlear development.
(A) Stereociliary bundles of the mouse cochlea were visualized by staining with Phalloidin at P0, P4 and P8. Pictures were taken from 10%, 30%, 50%, 70% and 90% positions from the basal end of the cochlear duct. (B) Angles of V-shaped hair bundles were measured by drawing two lines along the medial side of the bundles using the Image J program. (C) Angles of the hair bundles are plotted as a function of relative distance from the basal end of the cochlea at P4, P8, and P21.
Figure 2
Figure 2. Schematic representation of distinct gene expression patterns along the tonotopic axis at P0 and P8.
Gene profiles obtained from the microarray were classified based on the spatial (along the tonotopic axis) as well as temporal (between P0 and P8) expression changes. Expression levels of individual genes were compared between base and apex at P0, and classified into three categories: relatively constant along the cochlear duct (average fold-changes <1.5), higher in the apex or base (average fold-changes >1.5). Then, genes in each category were subdivided into three groups base on the expression patterns at P8 (constant, higher in the base or apex), which yielded nine distinct groups. See text for details.
Figure 3
Figure 3. Comparison between qRT-PCR and microarray data showed high correlation.
(A) An example of qRT-PCR results for Fst, which showed increasing base-to-apex gradients in expression levels at both P0 and P8. (B) An example showing high correlation between qRT-PCR results and microarray data for Fst (Pearson correlation coefficient, r = 0.982). (C) Comparisons between qRT-PCR results and microarray data for all 22 genes examined showed good correlations (r = 0.862).
Figure 4
Figure 4. Expression patterns of Tnc and Nov in the cochlea during neonatal development.
Expression patterns of Tnc (A,B) and Nov (C,D) were examined by in situ hybridization at P0 (A,C) and P8 (B,D). (A,B) Tnc transcripts were observed in the basilar membrane in an increasing gradient toward the apex at both P0 and P8 (A1–B3, arrows). Tnc expression was also positive in the differentiating hair cells (Atoh1 expression domain) at P0 (inset in A1, arrowheads), but was down-regulated at P8. (C,D) Nov was expressed in the basilar membrane at P0 and P8. Nov expression levels were relatively constant at P0 along the cochlear duct and gradually decreased toward the apex by P8 (D). Scale bar in A (200 µm) applies to B, C, and D; scale bar in A1 (50 µm) applies to A1–A3, B1–B3, C1–C3, and D1–D3.
Figure 5
Figure 5. Expression patterns of Fst in the cochlea during embryonic and neonatal development.
Fst transcripts were present in the lesser epithelial ridge (LER) region of the cochlea in an increasing base-to-apex gradient during neonatal (A,B) and embryonic development (C-H). (A,B) At P0 and P8, Fst expression was barely detectable in the basal cochlear turns (A1,B1, asterisks), but was evident in the lateral side of the LER in the middle turns (A2,B2, brackets) and its expression domain included the entire LER region in the apical turns (A3,B3, brackets). Insets in A1–B3 show expression domains of Myo15 or Atoh1 in the adjacent sections to indicate the location of hair cells. Arrowheads indicate the lateral border of differentiating hair cells. (C,D) Fst expression patterns at E15.5 were comparable to those observed at P0 and P8. Fst expression domains largely overlapped that of Bmp4 in the LER area. (E1–H3) The increasing gradient of Fst expression patterns in the cochlea was already apparent in the cochlear primordium at E10.5 (F3,G3,H3, asterisk, brackets). Fst expression was not detectable in the presumptive vestibular organs including the lateral crista (E1–E3). Expression domains of Bmp4 (E1,F1,G1,H1) and Lfng (E2,F2,G2,H2) indicated the lateral and medial regions of the developing cochlea, respectively. The schematic diagram indicates the level of sections for the pictures shown in E1–H3. Scale bar in A (200 µm) applies to B-D; scale bar in A1 (50 µm) applies to A1–A3, B1–B3, C1–C3, and D1–D3; Scale bar in E1 (100 µm) applies to E1–H3.

Similar articles

Cited by

References

    1. Davis RL. Gradients of neurotrophins, ion channels, and tuning in the cochlea. Neuroscientist. 2003;9:311–316. - PubMed
    1. Mann ZF, Kelley MW. Development of tonotopy in the auditory periphery. Hear Res. 2011;276:2–15. - PubMed
    1. Davis RL, Liu Q. Complex primary afferents: What the distribution of electrophysiologically-relevant phenotypes within the spiral ganglion tells us about peripheral neural coding. Hear Res. 2011;276:34–43. - PMC - PubMed
    1. Meyer AC, Frank T, Khimich D, Hoch G, Riedel D, et al. Tuning of synapse number, structure and function in the cochlea. Nat Neurosci. 2009;12:444–453. - PubMed
    1. Ren T. Longitudinal pattern of basilar membrane vibration in the sensitive cochlea. Proc Natl Acad Sci U S A. 2002;99:17101–17106. - PMC - PubMed

Publication types

MeSH terms

Associated data