. 2012 Jul 1;3(7):1478-91.
doi: 10.1364/BOE.3.001478. Epub 2012 Jun 4.

Automated segmentation of retinal blood vessels in spectral domain optical coherence tomography scans

Automated segmentation of retinal blood vessels in spectral domain optical coherence tomography scans

Matthäus Pilch et al. Biomed Opt Express. .

Abstract

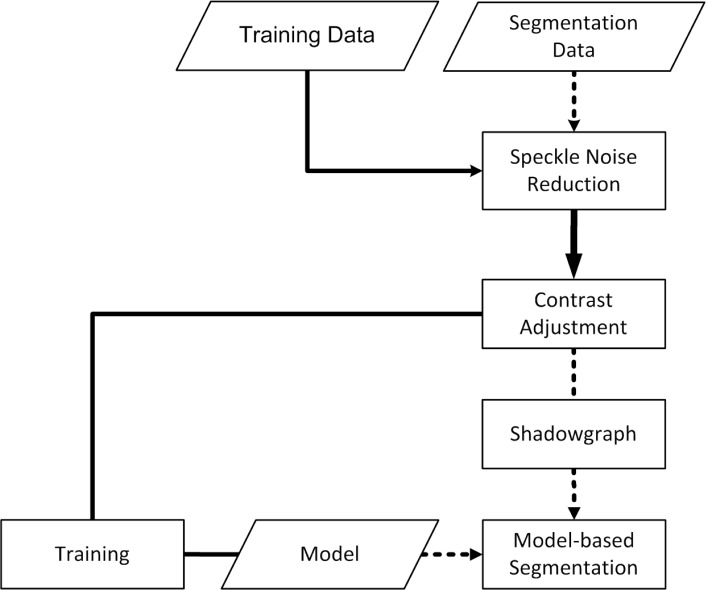
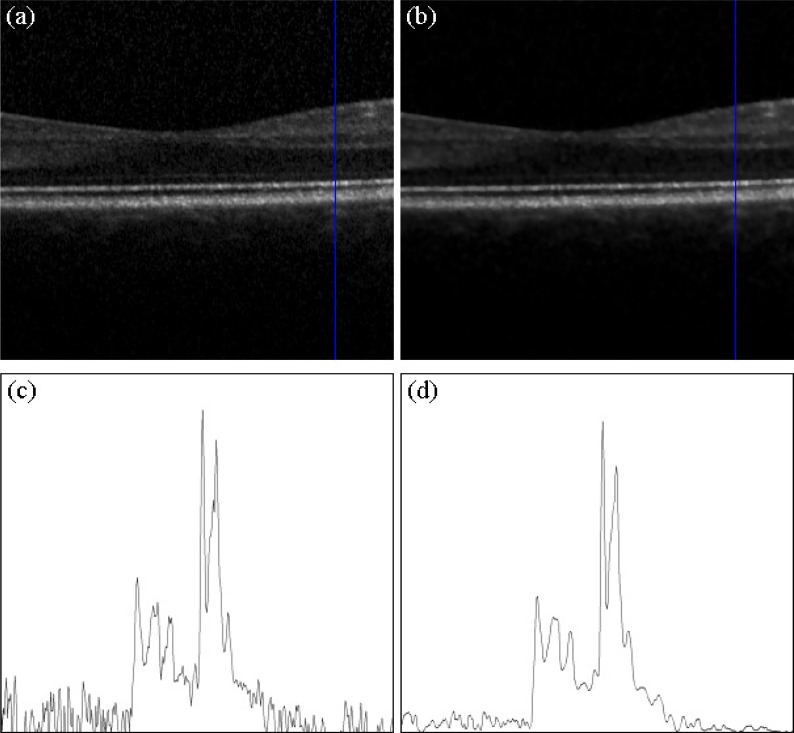
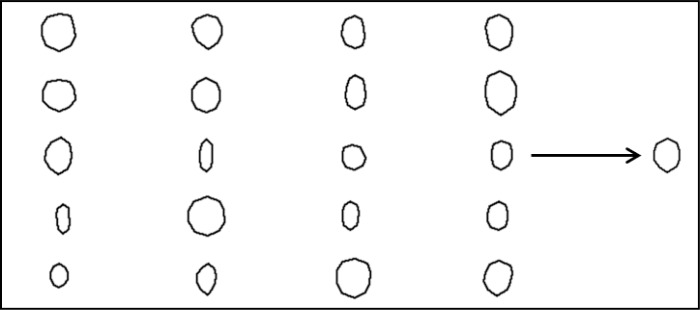
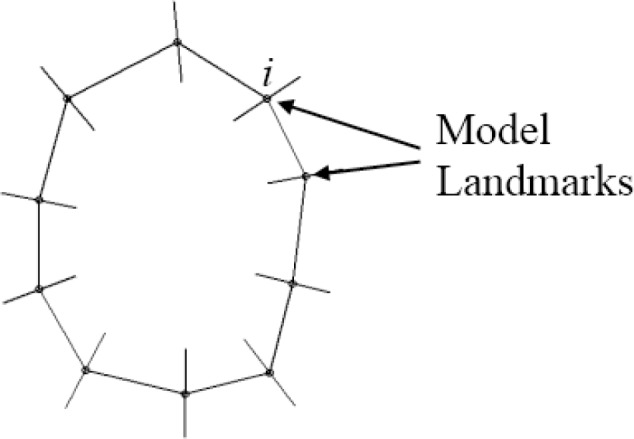
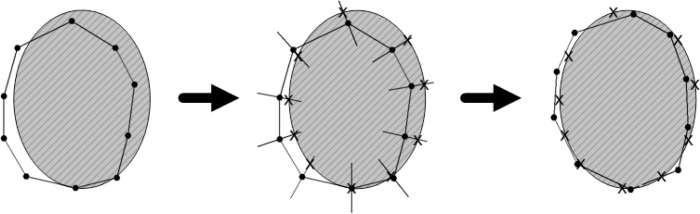
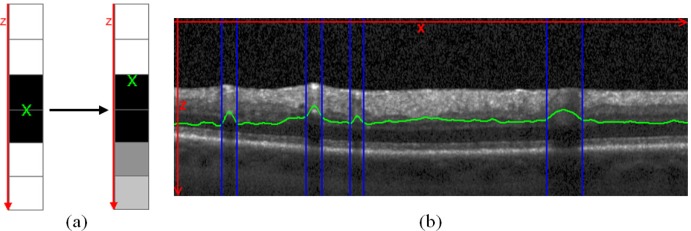
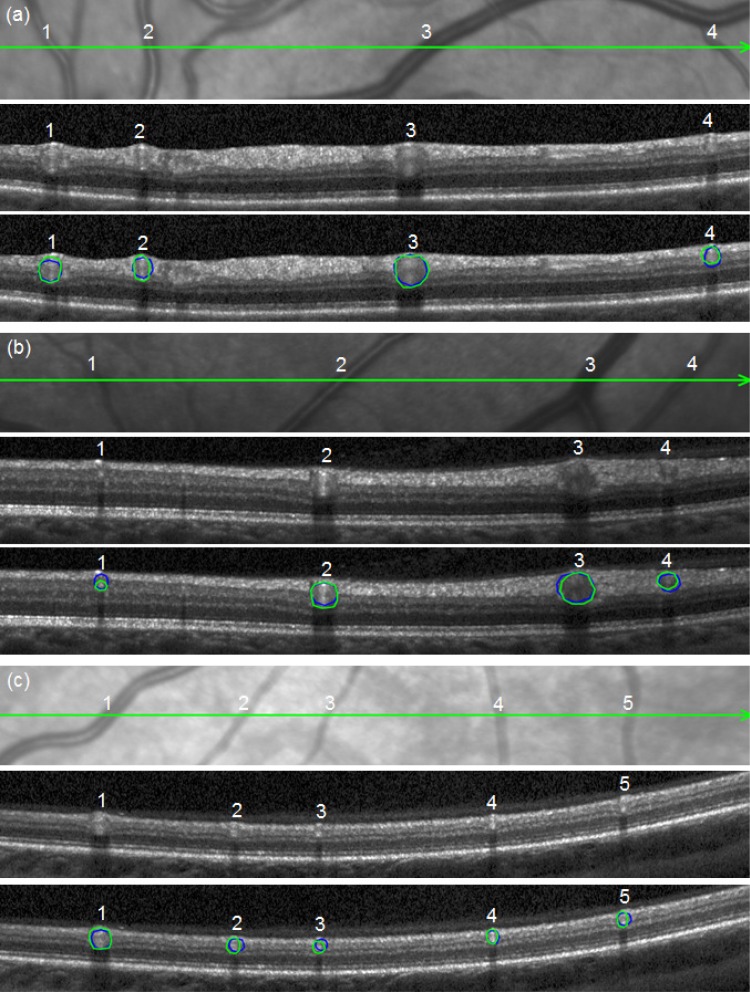
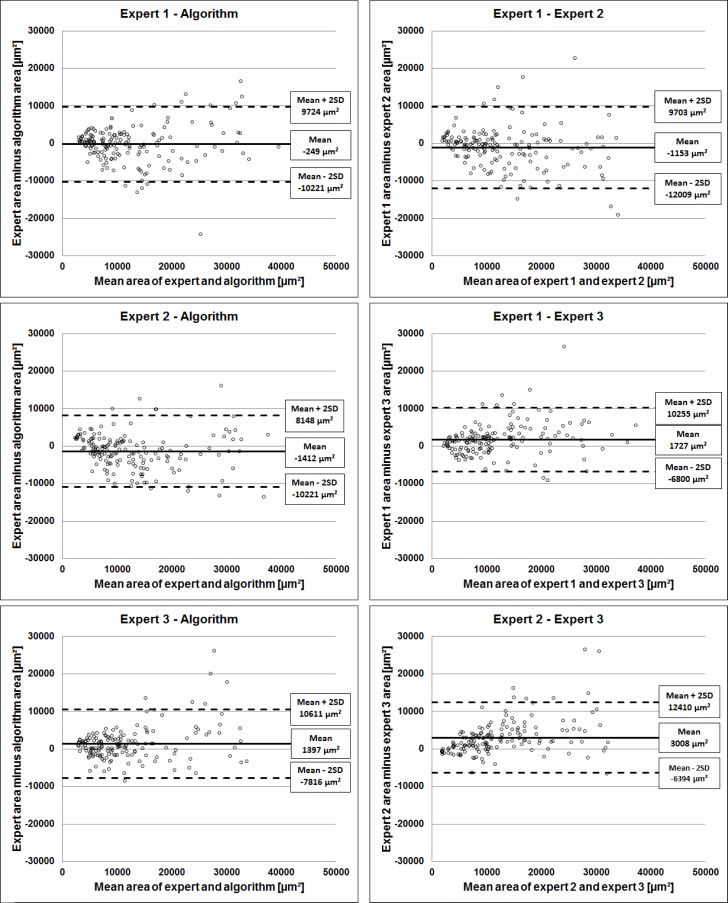
The correct segmentation of blood vessels in optical coherence tomography (OCT) images may be an important requirement for the analysis of intra-retinal layer thickness in human retinal diseases. We developed a shape model based procedure for the automatic segmentation of retinal blood vessels in spectral domain (SD)-OCT scans acquired with the Spectralis OCT system. The segmentation procedure is based on a statistical shape model that has been created through manual segmentation of vessels in a training phase. The actual segmentation procedure is performed after the approximate vessel position has been defined by a shadowgraph that assigns the lateral vessel positions. The active shape model method is subsequently used to segment blood vessel contours in axial direction. The automated segmentation results were validated against the manual segmentation of the same vessels by three expert readers. Manual and automated segmentations of 168 blood vessels from 34 B-scans were analyzed with respect to the deviations in the mean Euclidean distance and surface area. The mean Euclidean distance between the automatically and manually segmented contours (on average 4.0 pixels respectively 20 µm against all three experts) was within the range of the manually marked contours among the three readers (approximately 3.8 pixels respectively 18 µm for all experts). The area deviations between the automated and manual segmentation also lie within the range of the area deviations among the 3 clinical experts. Intra reader variability for the experts was between 0.9 and 0.94. We conclude that the automated segmentation approach is able to segment blood vessels with comparable accuracy as expert readers and will provide a useful tool in vessel analysis of whole C-scans, and in particular in multicenter trials.

Keywords: (100.0100) Image processing; (100.3008) Image recognition, algorithms and filters; (110.6880) Three-dimensional image acquisition; (170.4500) Optical coherence tomography.


Figures

Fig. 1
Fig. 1
The segmentation algorithm consists of two parts. First, a statistical shape model is trained via the point distribution model in the solid procedure flow. The actual segmentation process of unseen images is then performed with the creation of a shadow graph and with the active shape model method based on the data of the statistical shape model from the first step (dotted arrows in the flow chart).
Fig. 2
Fig. 2
(a) Input B-scan recorded with the Spectralis OCT centered on a healthy human macula. (b) Processed speckle noise suppression with the Bayesian estimation approach. (c) Sampled A-scan of the raw image. The noise component is strong and blurs the original signal. (d) Sampled A-scan of the suppressed image. The noise component is much lower and the retinal structures are preserved.
Fig. 3
Fig. 3
On the left side, 20 shapes of different manually segmented blood vessels are shown. On the right side, the mean blood vessel shape is shown that has been obtained by averaging the 10 landmarks for all shapes of the set.
Fig. 4
Fig. 4
The grey-level variations are sampled on the normal of each landmark for all blood vessel shapes of the training set. The grey-level appearance is used to search for blood vessel objects in unseen images.
Fig. 5
Fig. 5
Segmentation procedure with the active shape model for one iteration. The mean shape model is placed near the image object (left) and the grey-level profiles of the image are compared to the model profiles for each landmark (middle). The model parameters are updated to move the model to the best positions marked as crosses (right).
Fig. 6
Fig. 6
(a) The basic concept of the blood vessel shadowgraph with the grey-level centers of each A-scan. If the grey-level intensities are distributed in the same manner for the top and bottom region of the A-scan, the center lies in the middle. If the intensities got weaker due to the blood vessel shadows, the center migrates upward. (b) The grey-level centers processed for an entire B-scan are visualized as green line and the lateral segmentation of the blood vessel shadow is marked by blue vertical lines after thresholding.
Fig. 7
Fig. 7
Segmentation results of the automated approach (blue lines) and the clinical expert 1 (green lines). (a), (b) and (c) references to the B-scans.
Fig. 8
Fig. 8
Area deviations between the algorithm and the three experts and the inter grader deviations are visualized as Bland-Altman plots.

References

    1. Geitzenauer W., Hitzenberger C. K., Schmidt-Erfurth U. M., “Retinal optical coherence tomography: past, present and future perspectives,” Br. J. Ophthalmol. 95(2), 171–177 (2011).10.1136/bjo.2010.182170 - DOI - PubMed
    1. Hoover A., Kouznetsova V., Goldbaum M., “Locating blood vessels in retinal images by piecewise threshold probing of a matched filter response,” IEEE Trans. Med. Imaging 19(3), 203–210 (2000).10.1109/42.845178 - DOI - PubMed
    1. A. Budai, G. Michelson, and J. Hornegger, “Multiscale Blood Vessel Segmentation in Retinal Fundus Images,” in Proceedings of Bildverarbeitung für die Medizin (Springer Verlag, 2010), pp. 261–265.
    1. Sinthanayothin C., Boyce J. F., Cook H. L., Williamson T. H., “Automated localisation of the optic disc, fovea, and retinal blood vessels from digital colour fundus images,” Br. J. Ophthalmol. 83(8), 902–910 (1999).10.1136/bjo.83.8.902 - DOI - PMC - PubMed
    1. Niemeijer M., Garvin M. K., van Ginneken B., Sonka M., Abràmoff M. D., “Vessel segmentation in 3D spectral OCT scans of the retina,” Proc. SPIE 6914, 69141R–, 69141R-8. (2008).10.1117/12.772680 - DOI

LinkOut - more resources