. 2012 Jul 1;3(7):1492-505.
doi: 10.1364/BOE.3.001492. Epub 2012 Jun 4.

Image formation by linear and nonlinear digital scanned light-sheet fluorescence microscopy with Gaussian and Bessel beam profiles

Image formation by linear and nonlinear digital scanned light-sheet fluorescence microscopy with Gaussian and Bessel beam profiles

Omar E Olarte et al. Biomed Opt Express. .

Abstract

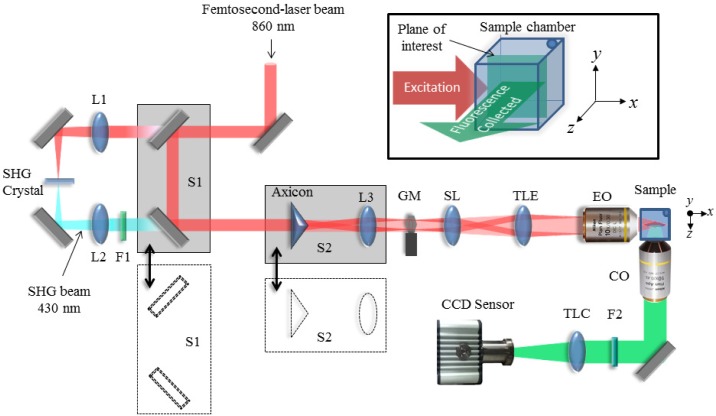
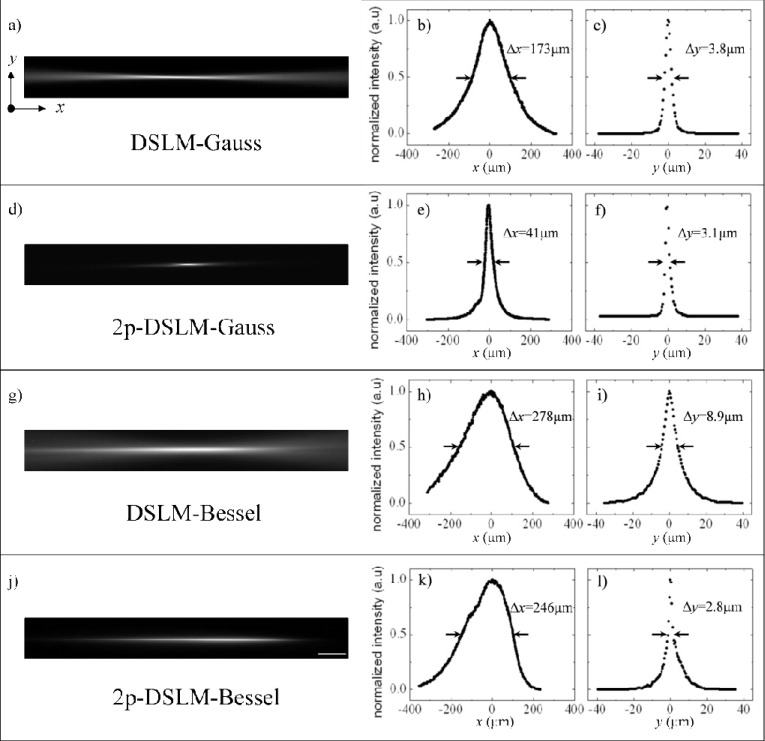
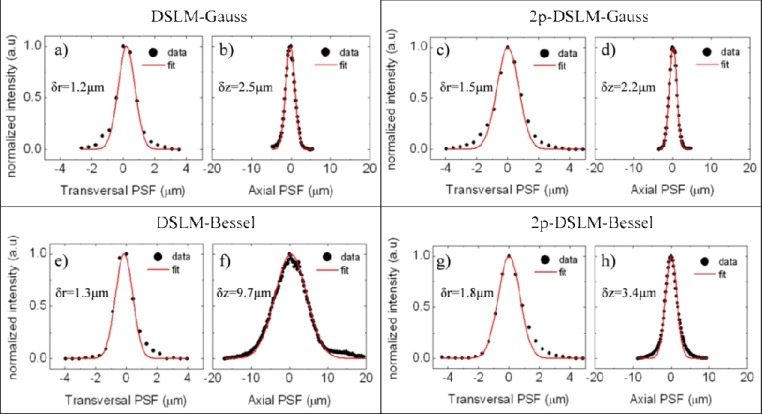
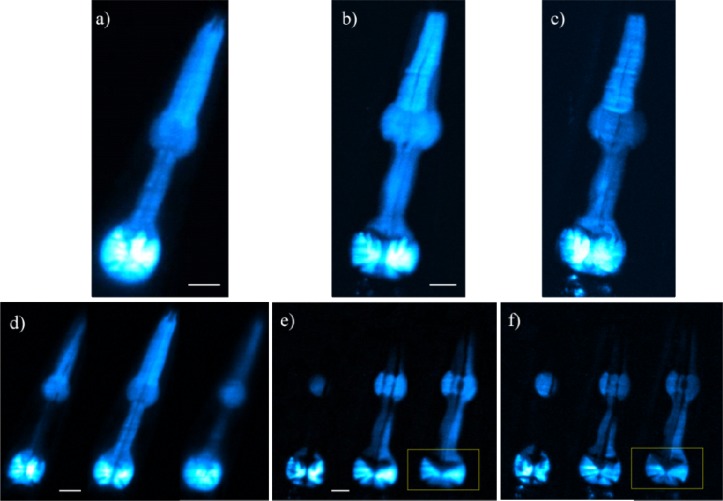
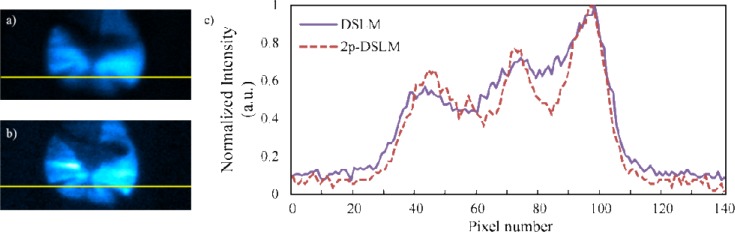
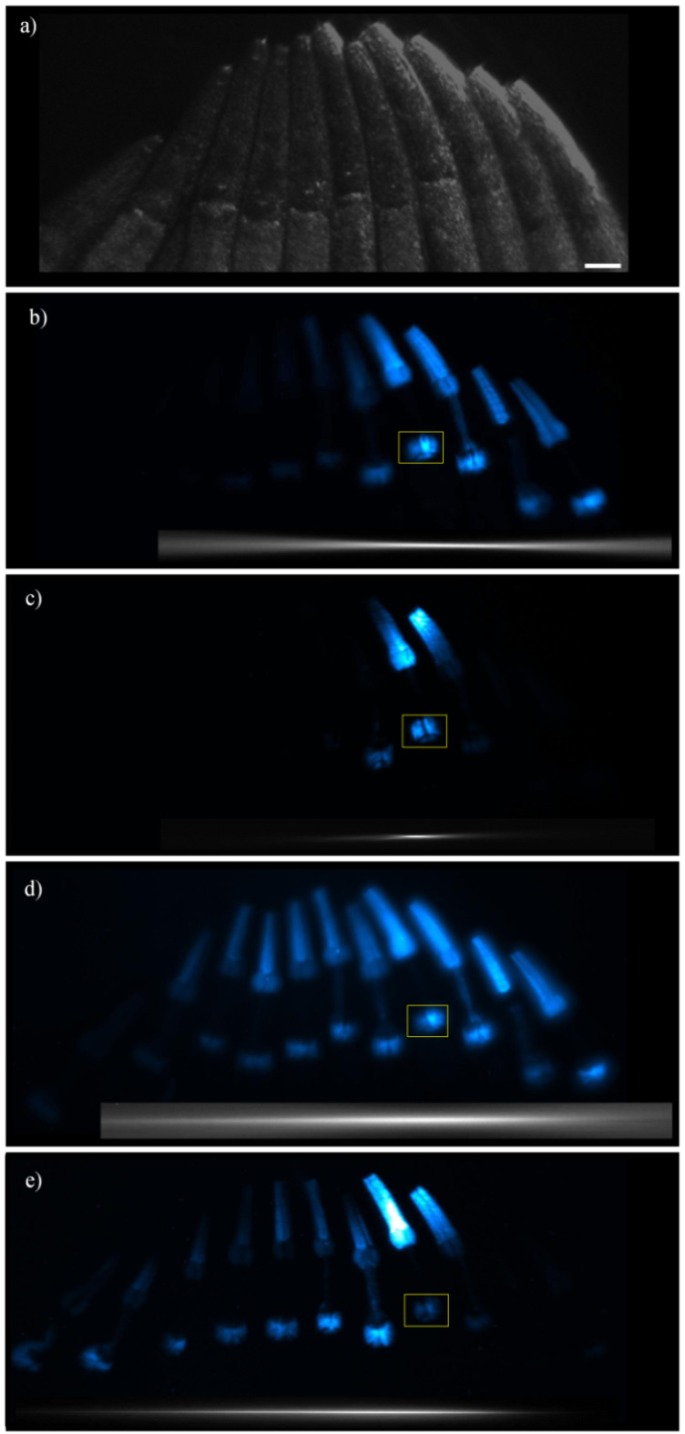
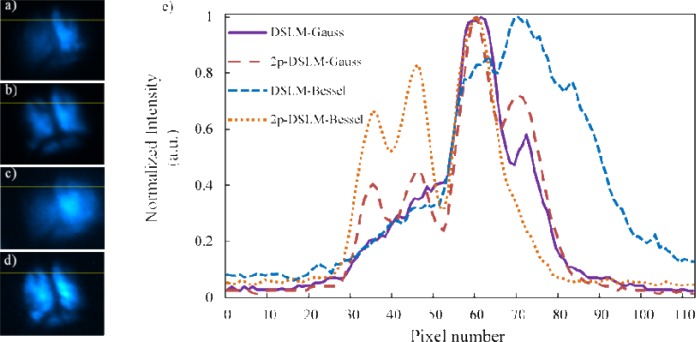
We present the implementation of a combined digital scanned light-sheet microscope (DSLM) able to work in the linear and nonlinear regimes under either Gaussian or Bessel beam excitation schemes. A complete characterization of the setup is performed and a comparison of the performance of each DSLM imaging modality is presented using in vivoCaenorhabditis elegans samples. We found that the use of Bessel beam nonlinear excitation results in better image contrast over a wider field of view.

Keywords: (140.3300) Laser beam shaping; (170.3880) Medical and biological imaging; (180.2520) Fluorescence microscopy; (180.4315) Nonlinear microscopy; (190.4180) Multiphoton processes.


Figures

Figure 1
Figure 1
Schematic diagram of our DLSM setup. The translation stage S1 allows switching between linear DSLM, where the beam pass through the SHG crystal and lenses L1 and L2, and 2p-DLSM where the femtosecond-laser beam pass unmodified. Gaussian or Bessel beams are selected by moving the translation stage S2 that contains an axicon and the Fourier transforming lens L3. A galvo mirror GM, a scan lens (SL), a tube lens (TLE) and an excitation objective lens (EO) are used to create the light sheet with the desired properties at the sample plane. The fluorescence generated in the sample is collected at 90 degrees by a collection objective lens (CO) and a regular tube lens (TLC) that forms image onto the CCD sensor with the designed magnification. Filters F1 and F2 are used to cut off the excitation light from the fluorescence images collected. The inset (top-right) shows the excitation-collection geometry that defines the notation of the axes used in this work.
Figure 2
Figure 2
Normalized fluorescence images and intensity profiles along x and y for the different excitation beams: a-c) DSLM with Gaussian beams, d-f) 2p-DSLM with Gaussian beams, g-i) DSLM with BB and j-l) 2p-DSLM with BB. The FWHM widths are indicated between arrows for each modality and their corresponding values Δx and Δy are included. These values are also summarized in Table 1. Profiles were taken along x and y directions with the point of maximum intensity located at the origin of coordinates, see the reference axes in Fig. 1(a). Scale bar: 50 μm, a pixel of the image corresponds to 0.44 μm in the sample.
Figure 3
Figure 3
Example of the PSFs obtained for the system using a sample of fluorescent beads in agar. The experimental intensity profiles (black dots) and Gaussian fits (red lines) for both transversal (δr) and axial (δz) dimensions are shown for the different modalities: a, b) DSLM with Gaussian beams, c, d) 2p-DSLM with Gaussian beams, e, f) DSLM with BB and g, h) 2p-DSLM with Bessel beams. The FWHM widths calculated from the Gaussian fit are shown over each graph. The average values of the PSF widths for 5 beads are reported in the Table 1
Figure 4
Figure 4
Images of a CFP-fluorescent pharynx of a C. elegans. Figures (a-c) are maximum intensity projections (MIP) of z stacks taken with a) the reference state-of-the-art SPIM system (Media 1), b) DSLM-Gauss (Media 2) and c) 2p-DSLM-Gauss (Media 3). Figures d) to f) show some individual sections of the z stacks obtained with SPIM (Media 4), DSLM (Media 5) and 2p-DSLM (Media 6) modalities using Gaussian beams, respectively. All z-stacks are composed of 54 images taken in steps of 2 μm. Scale bars: 20 μm.
Figure 5
Figure 5
Example of the contrast enhancement obtained by using 2p-DSLM. Regions of interest (ROI) taken from single optical sections (yellow squares on Fig. 4) for a) DSLM and b) 2p-DSLM. c) Plot of the intensity profiles along the selected lines for both modalities. Intensity values of the plots have been normalized to the maximum of each distribution.
Figure 6
Figure 6
Fluorescent images of a row of C. elegans aligned along the x direction. Figure a) shows the sample configuration as a reference (image taken using oblique illumination). Figures (b-e) are maximum intensity projections of z stacks taken with the four modalities available in our setup: b) DSLM-Gauss, c) 2p-DSLM-Gauss, d) DSLM-Bessel and e) 2p-DSLM-Bessel. The insets below each image indicate the position and extension of the excitation focal lines of Fig. 2. All z-stacks are composed of 50 images taken in steps of 2 μm. Scale bars: 50 μm.
Figure 7
Figure 7
Normalized profiles along a selected line taken from approximately the same optical section for all the DSLM modalities. Optical sections showing the same ROI and the selected line in yellow for a) DSLM with Gaussian beams, b) 2p-DSLM with Gaussian beams, c) DSLM with Bessel beams, and d) 2p-DSLM with Bessel beams. Plots of the intensity profiles along the selected lines are shown in e). Intensity of each plot has been normalized to its respective maximum value.

References

    1. Alford W. J., VanderNeut R. D., Zaleckas V. J., “Laser scanning microscopy,” Proc. IEEE 70(6), 641–651 (1982).10.1109/PROC.1982.12362 - DOI
    1. J. B. Pawley, ed., Handbook of Biological Confocal Microscopy, 3rd. ed. (Springer, 2006), pp. 680–689.
    1. Huisken J., Swoger J., Del Bene F., Wittbrodt J., Stelzer E. H. K., “Optical sectioning deep inside live embryos by selective plane illumination microscopy,” Science 305(5686), 1007–1009 (2004).10.1126/science.1100035 - DOI - PubMed
    1. Reynaud E. G., Kržič U., Greger K., Stelzer E. H. K., “Light sheet-based fluorescence microscopy: more dimensions, more photons, and less photodamage,” HFSP J 2(5), 266–275 (2008).10.2976/1.2974980 - DOI - PMC - PubMed
    1. Huisken J., Stainier D. Y. R., “Selective plane illumination microscopy techniques in developmental biology,” Development 136(12), 1963–1975 (2009).10.1242/dev.022426 - DOI - PMC - PubMed

LinkOut - more resources