

Analysis of skin lesions using laminar optical tomography
- PMID: 22808439
- PMCID: PMC3395492
- DOI: 10.1364/BOE.3.001701
Analysis of skin lesions using laminar optical tomography
Abstract
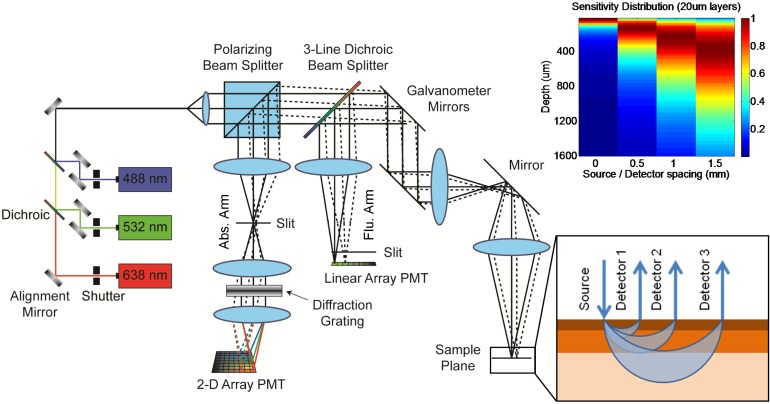
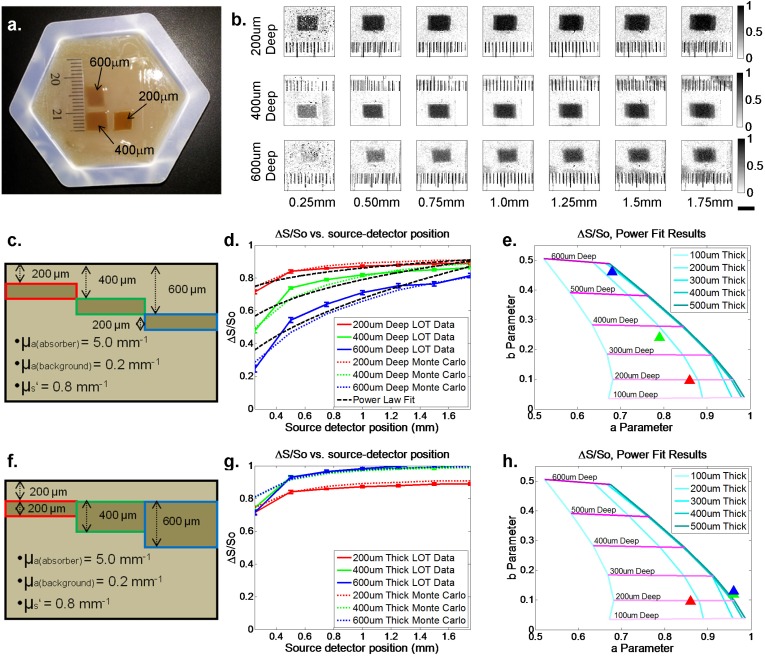
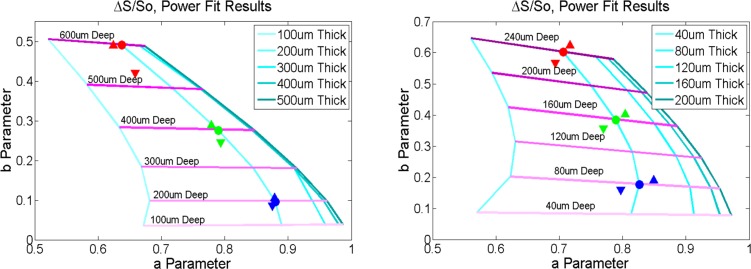
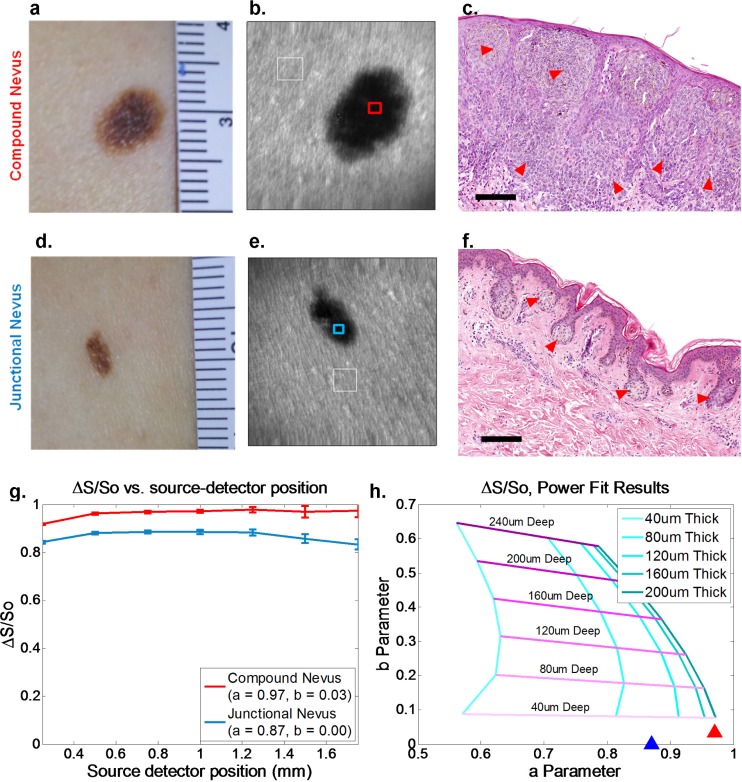
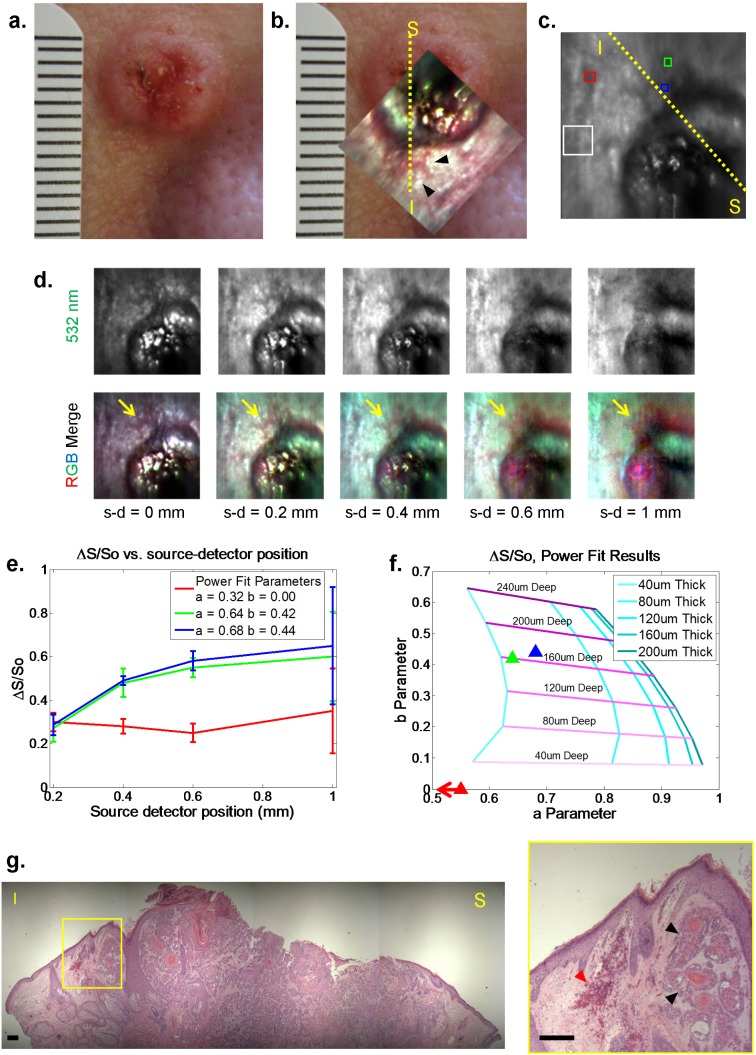
Evaluation of suspicious skin lesions by dermatologists is usually accomplished using white light examination and direct punch or surgical biopsy. However, these techniques can be imprecise for estimating a lesion's margin or level of dermal invasion when planning surgical resection. Laminar optical tomography (LOT) is an imaging technique capable of acquiring depth-sensitive information within scattering tissues. Here, we explore whether LOT data can be used to predict the depth and thickness of pigmented lesions using a range of simulations and phantom models. We then compare these results to LOT data acquired on normal and malignant skin lesions in vivo.
Keywords: (170.3880) Medical and biological imaging; (170.3890) Medical optics instrumentation.
Figures
Similar articles
-
Role of In Vivo Reflectance Confocal Microscopy in the Analysis of Melanocytic Lesions.Acta Dermatovenerol Croat. 2018 Apr;26(1):64-67. Acta Dermatovenerol Croat. 2018. PMID: 29782304 Review.
-
Sub-millimeter resolution 3D optical imaging of living tissue using laminar optical tomography.Laser Photon Rev. 2009 Feb 1;3(1-2):159-179. doi: 10.1002/lpor.200810031. Laser Photon Rev. 2009. PMID: 19844595 Free PMC article.
-
Assessment of pigmented skin lesions in terms of blood perfusion estimates.Skin Res Technol. 2004 Feb;10(1):43-9. doi: 10.1111/j.1600-0846.2004.00052.x. Skin Res Technol. 2004. PMID: 14731248 Clinical Trial.
-
Rapid diffused optical imaging for accurate 3D estimation of subcutaneous tissue features.iScience. 2025 Jan 23;28(2):111818. doi: 10.1016/j.isci.2025.111818. eCollection 2025 Feb 21. iScience. 2025. PMID: 39991548 Free PMC article.
-
Review of mesoscopic optical tomography for depth-resolved imaging of hemodynamic changes and neural activities.Neurophotonics. 2017 Jan;4(1):011009. doi: 10.1117/1.NPh.4.1.011009. Epub 2016 Nov 14. Neurophotonics. 2017. PMID: 27990452 Free PMC article. Review.
Cited by
-
Accelerating nonlinear reconstruction in laminar optical tomography by use of recursive SVD inversion.Biomed Opt Express. 2017 Aug 31;8(9):4275-4293. doi: 10.1364/BOE.8.004275. eCollection 2017 Sep 1. Biomed Opt Express. 2017. PMID: 28966864 Free PMC article.
-
High-dynamic-range fluorescence laminar optical tomography (HDR-FLOT).Biomed Opt Express. 2017 Mar 9;8(4):2124-2137. doi: 10.1364/BOE.8.002124. eCollection 2017 Apr 1. Biomed Opt Express. 2017. PMID: 28736659 Free PMC article.
-
Mesoscopic fluorescence molecular tomography of reporter genes in bioprinted thick tissue.J Biomed Opt. 2013 Oct;18(10):100501. doi: 10.1117/1.JBO.18.10.100501. J Biomed Opt. 2013. PMID: 24091624 Free PMC article.
-
Deep learning-based mesoscopic fluorescence molecular tomography: an in silico study.J Med Imaging (Bellingham). 2018 Jul;5(3):036001. doi: 10.1117/1.JMI.5.3.036001. Epub 2018 Sep 4. J Med Imaging (Bellingham). 2018. PMID: 30840720 Free PMC article.
-
Early assessment of burn severity in human tissue ex vivo with multi-wavelength spatial frequency domain imaging.Toxicol In Vitro. 2018 Oct;52:251-254. doi: 10.1016/j.tiv.2018.05.015. Epub 2018 Jun 1. Toxicol In Vitro. 2018. PMID: 29859991 Free PMC article.
References
-
- N. A. Howlader, N. M. Krapcho, N. Neyman, R. Aminou, S. F. Altekruse, C. L. Kosary, J. Ruhl, Z. Tatalovich, H. Cho, A. Mariotto, M. P. Eisner, D. R. Lewis, H. S. Chen, E. J. Feuer, and K. A. Cronin, eds., SEER Cancer Statistics Review, 1975-2009 (Vintage 2009 Populations), (National Cancer Institute, Bethesda, MD, 2012).
Grants and funding
LinkOut - more resources
Full Text Sources
Other Literature Sources