Space-time analysis of hospitalised dengue patients in rural Thailand reveals important temporal intervals in the pattern of dengue virus transmission
- PMID: 22808917
- PMCID: PMC4099473
- DOI: 10.1111/j.1365-3156.2012.03040.x
Space-time analysis of hospitalised dengue patients in rural Thailand reveals important temporal intervals in the pattern of dengue virus transmission
Abstract
Objective: To determine the temporal intervals at which spatial clustering of dengue hospitalisations occurs.
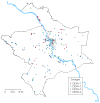
Methods: Space-time analysis of 262 people hospitalised and serologically confirmed with dengue virus infections in Kamphaeng Phet, Thailand was performed. The cases were observed between 1 January 2009 and 6 May 2011. Spatial coordinates of each patient's home were captured using the Global Positioning System. A novel method based on the Knox test was used to determine the temporal intervals between cases at which spatial clustering occurred. These intervals are indicative of the length of time between successive illnesses in the chain of dengue virus transmission.
Results: The strongest spatial clustering occurred at the 15-17-day interval. There was also significant spatial clustering over short intervals (2-5 days). The highest excess risk was observed within 200 m of a previous hospitalised case and significantly elevated risk persisted within this distance for 32-34 days.
Conclusions: Fifteen to seventeen days are the most likely serial interval between successive dengue illnesses. This novel method relies only on passively detected, hospitalised case data with household locations and provides a useful tool for understanding region-specific and outbreak-specific dengue virus transmission dynamics.
© 2012 Blackwell Publishing Ltd.
Conflict of interest statement
None
Figures


References
-
- Aldstadt J. An incremental Knox test for the determination of the interval between successive cases of an infectious disease. Stochastic Environmental Research and Risk Assessment. 2007;21:487–500.
-
- Bartley L, Donnelly C, Garnett G. The seasonal pattern of dengue in endemic areas: mathematical models of mechanisms. Transactions of the Royal Society of Tropical Medicine and Hygiene. 2002;96:387–397. - PubMed
-
- Beckett CG, Kosasih H, Faisal I, et al. Early detection of dengue infections using cluster sampling around index cases. The American Journal of Tropical Medicine and Hygiene. 2005;72:777–782. - PubMed
-
- Christophers SR. Aëdes aegypti (L.) the Yellow Fever Mosquito: its Life History, Bionomics and Structure. London: Cambridge University Press; 1960.
Publication types
MeSH terms
Grants and funding
LinkOut - more resources
Full Text Sources
Medical

