. 2012 Sep;23(17):3407-19.
doi: 10.1091/mbc.E12-05-0392. Epub 2012 Jul 18.

Ndm, a coiled-coil domain protein that suppresses macropinocytosis and has effects on cell migration

Affiliations

Ndm, a coiled-coil domain protein that suppresses macropinocytosis and has effects on cell migration

Jessica S Kelsey et al. Mol Biol Cell. 2012 Sep.

Abstract

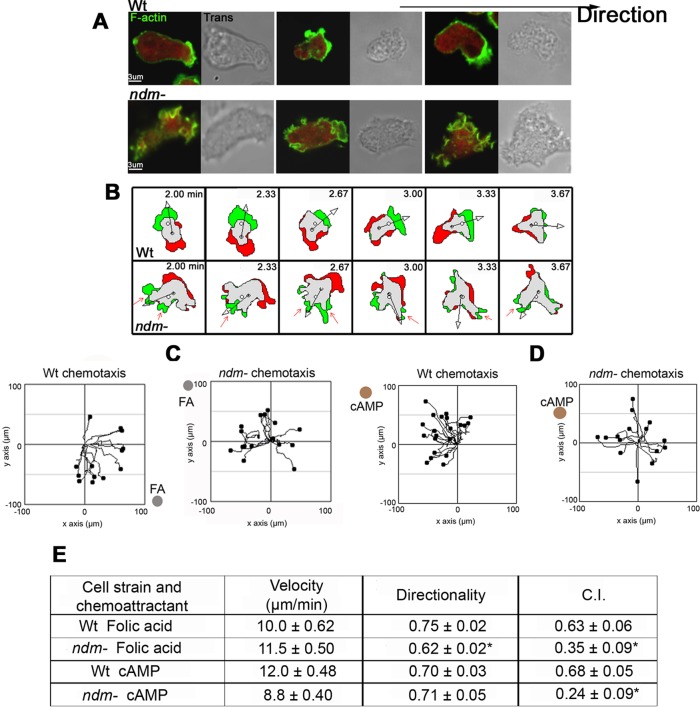
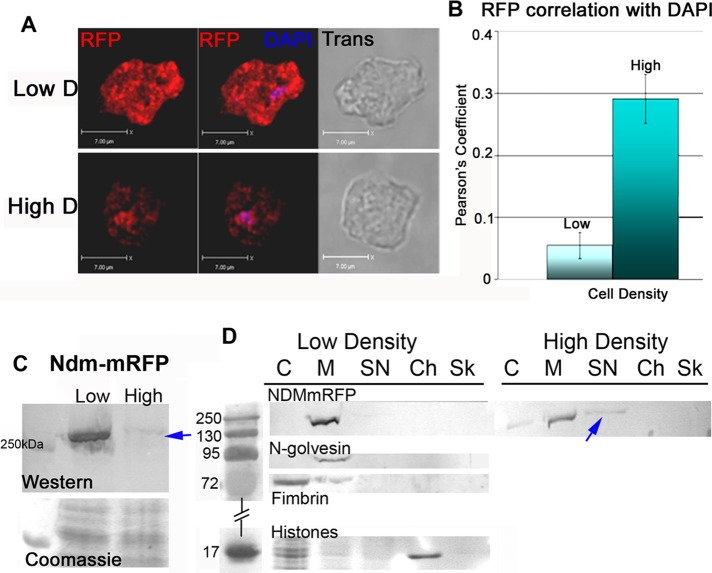
The ampA gene has a role in cell migration in Dictyostelium discoideum. Cells overexpressing AmpA show an increase in cell migration, forming large plaques on bacterial lawns. A second-site suppressor of this ampA-overexpressing phenotype identified a previously uncharacterized gene, ndm, which is described here. The Ndm protein is predicted to contain a coiled-coil BAR-like domain-a domain involved in endocytosis and membrane bending. ndm-knockout and Ndm-monomeric red fluorescent protein-expressing cell lines were used to establish a role for ndm in suppressing endocytosis. An increase in the rate of endocytosis and in the number of endosomes was detected in ndm(-) cells. During migration ndm(-) cells formed numerous endocytic cups instead of the broad lamellipodia structure characteristic of moving cells. A second lamellipodia-based function-cell spreading-was also defective in the ndm(-) cells. The increase in endocytosis and the defect in lamellipodia formation were associated with reduced chemotaxis in ndm(-) cells. Immunofluorescence results and glutathione S-transferase pull-down assays revealed an association of Ndm with coronin and F-actin. The results establish ndm as a gene important in regulating the balance between formation of endocytic cups and lamellipodia structures.


Figures

FIGURE 1:
FIGURE 1:
JSK2 plaque sizes indicate suppression of the ampOE phenotype. (A–G) Wild-type (WT), ampA, and JSK2 mutant plaques. The average areas are graphed in I. Plates were incubated at 22°C for 4 d. Scale bar, 1000 μm. n = 15+ plaques from at least three independent experiments. Error bars in I are SEM. *p < 0.05, indicating a significant difference between WT or AmpA OE and their respective JSK2 mutants. A p value of 0.88 indicating no significant difference was found when comparing ampA plaque sizes with amp/JSK2 plaque sizes. (H) Top, a diagram showing the insertion site of the REMI plasmid containing the blasticidin resistance cassette (bsr) into the ndm gene. It was inserted at the DpnII (GATC) site at base pair 368 via the complementary sites created by BamHI digestion (G′GATC). The black arrows show primer locations for PCR. Bottom, PCR analysis using primers flanking the predicted REMI plasmid insertion site shows a shift in product from 638 base pairs in WT DNA to 5000 base pairs in JSK2 DNA, confirming disruption of the JSK2 gene. J, protein domains predicted by the MotifScan program are indicated with amino acid positions (Pagni et al., 2007). LZ (leucine zipper), DH (double homology), GBD-FH3 (G-protein–binding formin homology 3), CAST (region of homology to the CAST protein), BAR (BAR domain), and NLS (nuclear localization signal). Black bars indicate the protein regions used in GST fusions. A model of the BAR domain is shown below (I-TASSER; Roy et al., 2010). Images are of dimers, with one BAR domain in orange and one in pink. Left, a view rotated 90°. Right, the dimer attached to a curved membrane, where the characteristic F-BAR domain curvature is evident.
FIGURE 2:
FIGURE 2:
Endocytosis is increased in ndm cells. (A) FITC-dextran was used to measure rates of endocytosis (μg dextran/106 cells) vs. time (min) in WT and ndm cells (n = 3+ independent experiments). Error bars, SEM. (B) Cells displaying endosomes containing FITC-dextran. Images are optical sections with fluorescent and transmitted images overlaid. (C) Quantification of endosomes. The area of total endosomes/cell (μm2/cell) was measured using total area of FITC fluorescence/cell. The number of dextran-containing vesicles (number of endosomes/cell) was calculated by quantifying the number of individual FITC-containing endosomes/cell. Only spots large enough to be endosomes (not much smaller than 1.6 μm2) were counted. The size of the endosomes was unaffected (mean size of endosomes, μm2). (D) Antibody to the p80 protein (green) was used to label endosomes. A corresponding transmitted image is also displayed. (E) The amount of immunofluorescence in p80 endosomes is shown. In C and E, *p < 0.05 (n = 30+ cells, at least three independent experiments).
FIGURE 3:
FIGURE 3:
The ndm knockout displays defects in cell spreading. (A) Three-dimensional (3D) reconstructed images of WT and ndm cells after growing overnight on coverslips. F-actin (green) and G-actin (red). (B) WT and ndm cell heights after 4 or >12 h of growing on coverslips (n = 3 independent experiments with 25+ cells per strain). Error bars, SEM. (C) Quantification of the perimeter at the base of the cells and the total volume of the cells for WT and ndm. Volocity 3D measurement software was used to calculate cell volume from the distribution of TRITC-DNase I fluorescence staining of G-actin in cells. The base perimeter was determined from traces of the cell circumference in optical sections at the coverslip, and the height of the cells was determined by measuring from the coverslip to the top of individual cells on the z-axis. *p < 0.05; n = 30+ cells per cell strain.
FIGURE 4:
FIGURE 4:
ndm cells display defects in cell migration. (A) Cells chemotaxing toward folic acid on coverslips were fixed and stained for F-actin (green) and G-actin (red). Optical sections are shown next to transmitted images. Three WT cells (top) and three ndm cells (bottom) are illustrated. (B–E) Cells on top of agar chemotaxing toward folic acid were imaged every 20 s. (B) Difference plots (Dynamic Image Analysis System; Solltech, Iowa City, IA). Top, WT cell; bottom, ndm cell. Gray areas are regions that remain the same, green areas represent regions of extension from the previous panel, and red areas represent regions of retraction. (C, D) Chemotaxis plots of WT and ndm cells migrating to (C) folic acid and (D) cAMP. Black dots represent cells. Individual paths >5 min are shown by black lines attached to each dot. The direction and distance of each cell from its origin at 0 are shown. The location of folic acid (FA) or cAMP is indicated by gray (FA) or brown (cAMP) dots. (E) Values for velocity, directionality, and CI of WT and ndm cells chemotaxing toward folic acid or cAMP. *p < 0.05 (n = 50+ cells from at least three independent experiments). Calculation of CI is given in Materials and Methods.
FIGURE 5:
FIGURE 5:
Ndm-mRFP expression changes as a function of density and development. (A) Cells growing at low and high densities were placed on coverslips for 15 min, fixed, and stained. Optical sections of cells stained for Ndm-mRFP indirect immunofluorescence (red signal). Overlays with DAPI-stained nuclei (blue) and transmitted images are shown. (B) Pearson coefficient values to determine correlation between Ndm and nuclei colocalization. The entire cell was included in colocalization values. 0, no colocalization; 1, complete colocalization. n = 30+ cells at each density from three independent experiments. (C) Western analysis of Ndm-mRFP levels at low and high cell densities (top). The arrow indicates the position of the Ndm-mRFP band. Coomassie staining for protein loading (bottom). (D) Cell fractionation results showing Ndm-mRFP localization in low- and high-density cells. Fractions are as follows: C, cytosol; Ch, chromatin; M, membrane; Sk, cytoskeleton; SN, soluble nuclear. Western blots with anti-RFP antibody (top); controls for protein fractionation (bottom). A blue arrow points out a small but noticeable shift in Ndm-mRFP signal into the soluble nuclear fraction.
FIGURE 6:
FIGURE 6:
Ndm functions in development. (A) RT-PCR showing relative Ndm transcript levels during development. At specific time points RNA was isolated. A cDNA copy of total RNA was used for PCR. ndm-specific primers were used to amplify the transcript levels. Ndm transcripts (left) and Ig7 control transcripts (right). (B) Cells were plated for development. Images were taken at the indicated times. WT (left), ndm (center), and Ndm-mRFP (right). Scale bar, 1000 μm.
FIGURE 7:
FIGURE 7:
Ndm colocalizes with specific actin-associating proteins. Low-density growing cells were placed on a coverslip, fixed, and stained. Fixation was either immediately after placing the growing cells on the coverslip (stationary [Sta.]) or after cells were induced to migrate to folic acid (Mig.). Left, Ndm-mRFP indirect immunofluorescence (red); middle, other protein antibodies (green); right, transmitted light images. (A) Clathrin, (B) coronin, and (C) phalloidin staining F-actin. Yellow arrows in A indicate points of clathrin and Ndm colocalization. Images are optical sections. Nuclei were stained with DAPI (blue). Yellow/orange signal indicates colocalization in the overlays. (E) Colocalization is indicated by a positive Pearson's coefficient. The entire cell was included in colocalization values. Colocalization of F-actin with DAPI was used as a negative control to represent 0 correlation. Complete colocalization gives a coefficient of 1. F-Actin colocalization was measured with Ndm-mRFP in both stationary (Sta.) and migrating (Mig.) cells. n = 30+ cells from at least two independent experiments.
FIGURE 8:
FIGURE 8:
Interaction of Ndm with coronin and actin. Ndm is not found at sites of macropinocytosis. (A) Western blot incubated with both anti-coronin and anti-actin antibodies (top); Coomassie staining (bottom). Lanes contain (from left) a molecular weight ladder, GST-only incubation with cell lysate, GST-GBD incubation with cell lysate, GST-CAST incubation with cell lysate, and a sample of total cell lysate shown as a reference. The blue arrow marks coronin at 55 kDa; the green arrow marks actin at 45 kDa. In the Coomassie-stained gel, GST fusion proteins are visible, GST (26 kDa), GST-GBD (116 kDa), and GST-CAST (142 kDa). (B) Growing cells expressing Ndm-mRFP were fixed and stained for RFP and F-actin localization. Three-dimensional reconstructed images of cells are shown for a better view of dorsal endocytic cup formations. Top, a top view looking down at the cells. Bottom, a side view rotated slightly. Ndm-mRFP localization (left), F-actin staining (center), and overlays (right). Endocytic cup structures are indicated by pink arrows in the overlay images.

Similar articles

Cited by

References

    1. Affolter M, Weijer CJ. Signaling to cytoskeletal dynamics during chemotaxis. Dev Cell. 2005;9:19–34. - PubMed
    1. Barlow AL, Macleod A, Noppen S, Sanderson J, Guérin CJ. Colocalization analysis in fluorescence micrographs: verification of a more accurate calculation of Pearson's correlation coefficient. Microsc Microanal. 2010;16:710–724. - PubMed
    1. Blumberg DD, Ho HN, Petty CL, Varney TR, Gandham S. AmpA, a modular protein containing disintegrin and ornatin domains, has multiple effects on cell adhesion and cell fate specification. J Muscle Res Cell Motil. 2002;23:817–828. - PubMed
    1. Brazill DT, Meyer LR, Hatton RD, Brock DA, Gomer RH. ABC transporters required for endocytosis and endosomal pH regulation in Dictyostelium. J Cell Sci. 2001;114:3923–3932. - PubMed
    1. Campos-Parra AD, Hernández-Cuevas NA, Hernandez-Rivas R, Vargas M. EhNCABP166: a nucleocytoplasmic actin-binding protein from Entamoeba histolytica. Mol Biochem Parasitol. 2010;172:19–30. - PubMed

Publication types

MeSH terms

LinkOut - more resources