

The effect of remodelling and contractility of the actin cytoskeleton on the shear resistance of single cells: a computational and experimental investigation
- PMID: 22809850
- PMCID: PMC3481572
- DOI: 10.1098/rsif.2012.0428
The effect of remodelling and contractility of the actin cytoskeleton on the shear resistance of single cells: a computational and experimental investigation
Abstract
The biomechanisms that govern the response of chondrocytes to mechanical stimuli are poorly understood. In this study, a series of in vitro tests are performed, in which single chondrocytes are subjected to shear deformation by a horizontally moving probe. Dramatically different probe force-indentation curves are obtained for untreated cells and for cells in which the actin cytoskeleton has been disrupted. Untreated cells exhibit a rapid increase in force upon probe contact followed by yielding behaviour. Cells in which the contractile actin cytoskeleton was removed exhibit a linear force-indentation response. In order to investigate the mechanisms underlying this behaviour, a three-dimensional active modelling framework incorporating stress fibre (SF) remodelling and contractility is used to simulate the in vitro tests. Simulations reveal that the characteristic force-indentation curve observed for untreated chondrocytes occurs as a result of two factors: (i) yielding of SFs due to stretching of the cytoplasm near the probe and (ii) dissociation of SFs due to reduced cytoplasm tension at the front of the cell. In contrast, a passive hyperelastic model predicts a linear force-indentation curve similar to that observed for cells in which the actin cytoskeleton has been disrupted. This combined modelling-experimental study offers a novel insight into the role of the active contractility and remodelling of the actin cytoskeleton in the response of chondrocytes to mechanical loading.
Figures
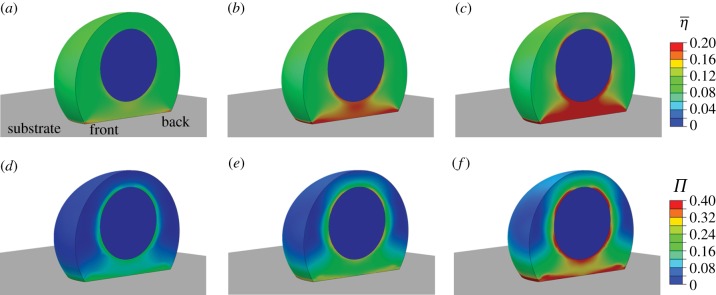
 : (a) at 30 s after signal initiation; (b) at 70 s after signal initiation; (c) at 1000 s after signal initiation. Contour plots of the variance (Π): (d) at 30 s after signal initiation; (e) at 70 s after signal initiation; (f) at 1000 s after signal initiation. A half cell is shown owing to symmetry.
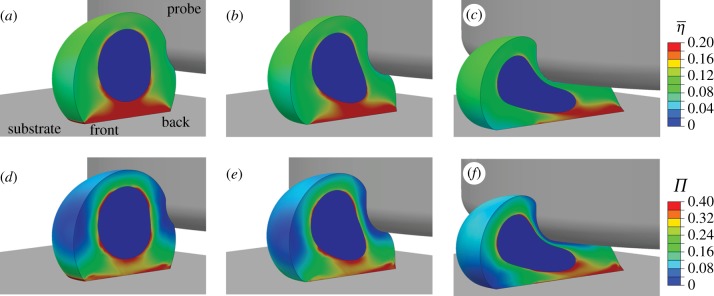
 at a probe indentation of: (a) 1.5 µm; (b) 4.7 µm; (c) 10.9 µm. Contour plots of the variance (Π) at a probe indentation of: (d) 1.5 µm; (e) 4.7 µm; (f) 10.9 µm. A half cell is shown owing to symmetry.
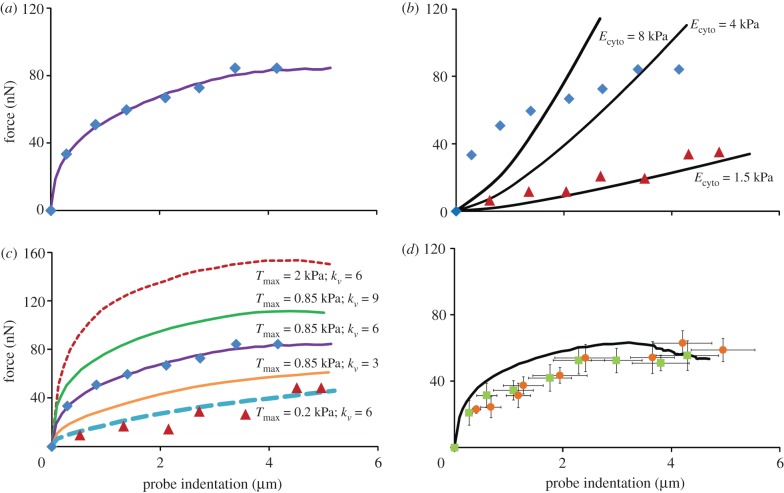
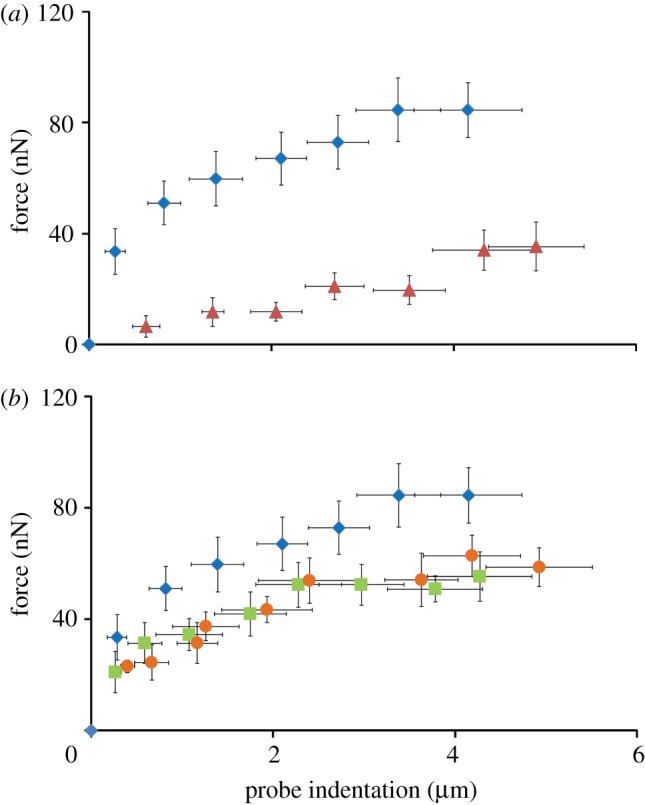
 ); mean experimental untreated cell (diamonds, n = 8) data included for comparison. (b) Computational probe–force indentation curves assuming a passive hyperelastic (solid line) cell cytoplasm. Predictions are shown for three values of cytoplasm stiffness: 1.5, 4 and 8 kPa. (c) Parametric study of the effect of active parameters Tmax and
  on predicted probe force–indentation curves (with Ecyto = 1.5 kPa). Diamonds, untreated cells (n = 8); triangles, cyto-D cells (n = 8). (d) Computational probe force–indentation curve for the active model with reduced cytoplasm stiffness (solid line; Ecyto = 0.03 kPa, Tmax = 0.85 kPa,
  ), and experimental probe force–indentation data (mean ± s.d.) for acrylamide (squares, n = 8) and colchicine (circles, n = 8) treated cells. (Online version in colour.)
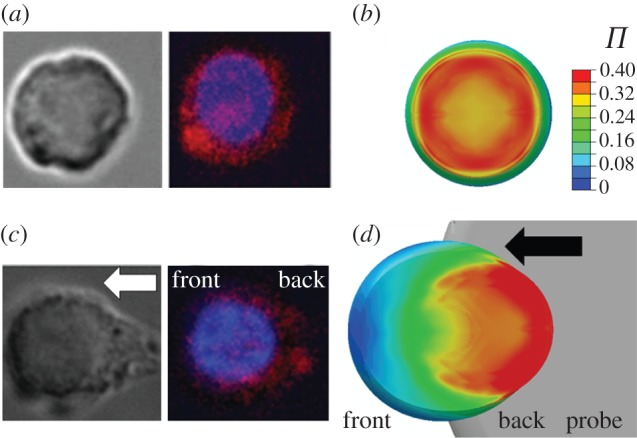
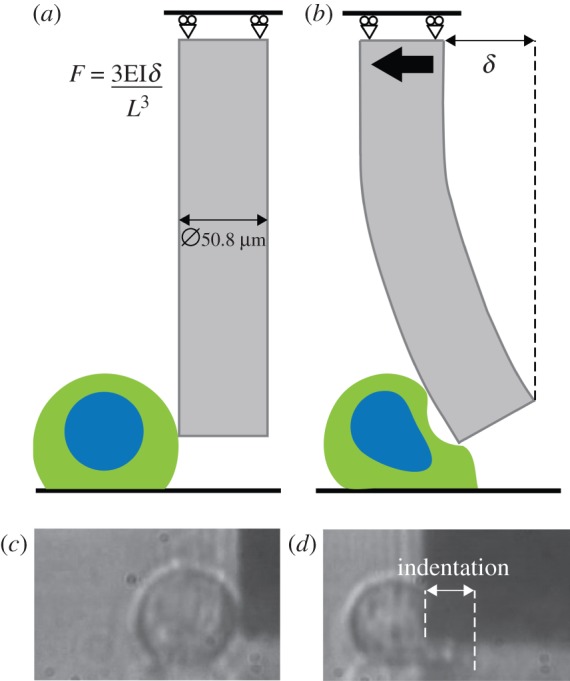
 ). (c) Representative brightfield and fluorescent image (bottom-up view) of a cell after shear deformation. (d) Predicted distribution of the actin cytoskeleton following 10.9 µm of probe indentation. The arrow indicates the direction of probe movement.
References
-
- Knight M. M., Toyoda T., Lee D. A., Bader D. L. 2006. Mechanical compression and hydrostatic pressure induce reversible changes in actin cytoskeletal organisation in chondrocytes in agarose. J. Biomech. 39, 1547–1551 10.1016/j.jbiomech.2005.04.006 (doi:10.1016/j.jbiomech.2005.04.006) - DOI - PubMed
-
- Campbell J. J., Blain E. J., Chowdhury T. T., Knight M. M. 2007. Loading alters actin dynamics and up-regulates cofilin gene expression in chondrocytes. Biochem. Biophys. Res. Commun. 361, 329–334 10.1016/j.bbrc.2007.06.185 (doi:10.1016/j.bbrc.2007.06.185) - DOI - PubMed
-
- Leipzig N. D., Athanasiou K. A. 2008. Static compression of single chondrocytes catabolically modifies single-cell gene expression. Biophys. J. 94, 2412–2422 10.1529/biophysj.107.114207 (doi:10.1529/biophysj.107.114207) - DOI - PMC - PubMed
-
- Shieh A. C., Athanasiou K. A. 2007. Dynamic compression of single cells. Osteoarthritis Cartilage 15, 328–334 10.1016/j.joca.2006.08.013 (doi:10.1016/j.joca.2006.08.013) - DOI - PubMed
-
- Woods A., Wang G., Beier F. 2007. Regulation of chondrocyte differentiation by the actin cytoskeleton and adhesive interactions. J. Cell. Physiol. 213, 1–8 10.1002/jcp.21110 (doi:10.1002/jcp.21110) - DOI - PubMed
Publication types
MeSH terms
LinkOut - more resources
Full Text Sources