. 2012 Aug 31;287(36):30240-56.
doi: 10.1074/jbc.M112.374405. Epub 2012 Jul 18.

Mammalian target of rapamycin complex 1 (mTORC1) and 2 (mTORC2) control the dendritic arbor morphology of hippocampal neurons

Affiliations

Mammalian target of rapamycin complex 1 (mTORC1) and 2 (mTORC2) control the dendritic arbor morphology of hippocampal neurons

Malgorzata Urbanska et al. J Biol Chem. .

Abstract

Dendrites are the main site of information input into neurons. Their development is a multistep process controlled by mammalian target of rapamycin (mTOR) among other proteins. mTOR is a serine/threonine protein kinase that forms two functionally distinct complexes in mammalian cells: mTORC1 and mTORC2. However, the one that contributes to mammalian neuron development remains unknown. This work used short hairpin RNA against Raptor and Rictor, unique components of mTORC1 and mTORC2, respectively, to dissect mTORC involvement in this process. We provide evidence that both mTOR complexes are crucial for the proper dendritic arbor morphology of hippocampal neurons. These two complexes are required for dendritic development both under basal conditions and upon the induction of mTOR-dependent dendritic growth. We also identified Akt as a downstream effector of mTORC2 needed for proper dendritic arbor morphology, the action of which required mTORC1 and p70S6K1.


Figures

FIGURE 1.
FIGURE 1.
Effects of rapamycin and Raptor and Rictor shRNAs on the activity of mTORC1 and mTORC2, respectively. A, chronic application of rapamycin inhibited the activity of mTORC1 and mTORC2 in cultured hippocampal neurons. Western blot analysis of protein lysates obtained from hippocampal neurons cultured in vitro and treated with 100 nm rapamycin on DIV8 for 0.5, 2, 24, and 72 h is shown. Hippocampal neurons cultured in vitro were transfected on DIV8 for 3 days with either control pSUPER vector or pSUPER that encoded shRNA against Raptor (shRaptor#1, shRaptor#2) or Rictor (shRictor#1, shRictor#2). The cells were co-transfected with a GFP-coding vector for visualization. Afterward, the cells were stained with antibody against endogenous Raptor (B) and Rictor (C). AU, arbitrary units. Additionally, neurons transfected with shRNAs against Raptor were stained for P-S6 (Ser-235/S236) (D), whereas those transfected with shRictor were checked for P-Akt (Ser-473) (E). Representative images of transfected cells are presented. The efficiency of the shRNAs was estimated by analyzing the average intensity of Raptor (B) or Rictor (C) immunostaining of transfected cells (Raptor: pSUPER, n = 49; shRaptor#1, n = 37; shRaptor#2, n = 42; shRictor#1, n = 40; shRictor#2, n = 47; Rictor: pSUPER, n = 32; shRaptor#1, n = 32; shRaptor#2, n = 31; shRictor#1, n = 32; shRictor#2, n = 32). The effects of Raptor and Rictor knockdown on mTORC1 and mTORC2 activity, respectively, were estimated based on the average intensity of P-S6 (D) and P-Akt (E) immunostaining of the cell soma of transfected cells (P-S6: pSUPER, n = 60; shRaptor#1, n = 59; shRaptor#2, n = 60; P-Akt: pSUPER, n = 73; shRictor#1, n = 71; shRictor#2, n = 62). Cell images were obtained from three independent culture batches. Error bars indicate S.E. ***, p < 0.001; ns, not significant (Mann-Whitney test). Scale bar = 10 μm.
FIGURE 2.
FIGURE 2.
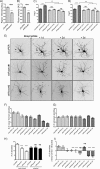
Knockdown of Raptor or Rictor retards the dendritic arborization of hippocampal neurons. Cultured in vitro hippocampal neurons were transfected on DIV8 for 3 days with either control pSUPER vector or pSUPER that encoded shRNA against Raptor (shRaptor#1, shRaptor#2) or Rictor (shRictor#1, shRictor#2). In additional control variants, neurons were transfected with vectors that encoded scrambled shRNAs: sc-shRaptor#1, sc-shRaptor#2, sc-shRictor#1, or sc-shRictor#2. The cells were co-transfected with GFP-coding vector for the visualization of neuronal morphology. A, shown are representative images of neurons transfected with pSUPER, pSUPER-shRaptor#1, or pSUPER-shRictor#2. B, TNDT of hippocampal neurons after Raptor or Rictor knockdown (pSUPER, n = 30; shRaptor#1, n = 31; shRaptor#2, n = 36; shRictor#1, n = 36; shRictor#2, n = 36). C, shown are TNDT of hippocampal neurons transfected with plasmids that encoded scrambled shRNAs (pSUPER: n = 60, sc-shRaptor#1, n = 51; sc-shRaptor#2, n = 51, sc-shRictor#1, n = 54; sc-shRictor#2, n = 51). TDL (n as in B) (D) and Sholl analysis (n as in B) (E) of hippocampal neurons after Raptor or Rictor knockdown is shown. Cell images were obtained from three independent culture batches. Scale bar = 20 μm. F–H, the effect of rapamycin, Rictor, and Raptor knockdown on cell body area of cultured hippocampal neurons is shown. Cultured in vitro hippocampal neurons were transfected on DIV7 for 3 or 5 days with either control pSUPER vector or pSUPER that encoded shRNA against Raptor (shRaptor#1, shRaptor#2) or Rictor (shRictor#1, shRictor#2). The cells were co-transfected with a GFP-coding vector for visualization. F, shown is average cell body area of neurons transfected for 3 days with control pSUPER vector (n = 50) or pSUPER that encoded shRNA against Raptor (shRaptor#1, n = 54; shRaptor#2, n = 55) or Rictor (shRictor#1, n = 49; shRictor#2, n = 53). G, shown is average cell body area of neurons transfected for 3 days with control pSUPER vector treated for 3 days with DMSO (n = 36) or 100 nm rapamycin (R) (n = 35). H, shown is average cell body area of neurons transfected for 5 days with control pSUPER vector (n = 80) or pSUPER that encoded shRNA against Raptor (shRaptor#1 n = 79; shRaptor#2, n = 76) or Rictor (shRictor#1, n = 81; shRictor#2, n = 79). Cell images were obtained from three independent culture batches. Error bars indicate S.E. ***, p < 0.001; **, p < 0.01 (Mann-Whitney test).
FIGURE 3.
FIGURE 3.
Morphological effects of Raptor and Rictor silencing are rescued by overexpression of human Raptor and Rictor, respectively. A, when overexpressed in HEK293 cells, GFP-tagged hRaptor was not recognized by co-transfected shRNAs against rat Raptor. B-E, and H-J, hippocampal neurons cultured in vitro were co-transfected on DIV8 for 3 days with EFα-β-gal (control) or hRaptor or hRictor and control pSUPER vector or pSUPER that encoded shRNA against Raptor (shRaptor#1, shRaptor#2) or Rictor (shRictor#2). B, shown are representative images of neurons transfected with either hRaptor or EFα-β-gal and control pSUPER vector or pSUPER that encoded shRNA against Raptor. Neuronal morphology was visualized by co-transfected monomeric red fluorescent protein. Shown is TNDT (pSUPER/β-gal, n = 47; shRaptor#1/β-gal, n = 51; shRaptor#2-gal, n = 51, pSUPER/hRaptor, n = 41; shRaptor#1/hRaptor, n = 40; shRaptor#2/hRaptor, n = 39) (C), TDL (n as in C) (D), and Sholl analysis (n as in C) (E) of hippocampal neurons after transfection with indicated plasmids. F, when overexpressed in HEK293 cells, myc-tagged hRictor was not recognized by co-transfected shRictor#2 against rat Rictor. G, shown are representative images of neurons transfected with either hRictor or EFα-β-gal and control pSUPER vector or pSUPER that encoded shRNA against Rictor. Neuronal morphology was visualized by co-transfected GFP. Shown is TNDT (pSUPER/β-gal, n = 52; shRictor#2/β-gal, n = 52; pSUPER/hRictor, n = 49; shRictor#2/hRictor, n = 41) (H), TDL (n as in H) (I), and Sholl analysis (n as in H) (J) of hippocampal neurons after transfection with the indicated plasmids. Cell images were obtained from three independent culture batches. Error bars indicate S.E. ***, p < 0.001; **, p < 0.01 (Mann-Whitney test). Scale bar = 20 μm.
FIGURE 4.
FIGURE 4.
Raptor and Rictor knockdown inhibits dendritic growth under basal culture conditions. A and B, doxycycline (dox)-induced expression of shRNAs that target Raptor and Rictor diminish the expression of targeted protein. Hippocampal neurons cultured in vitro were transfected on DIV6 with a plasmid that encoded tTS and either control pSUPERTRE vector or pSUPERTRE that encoded shRNA against Raptor (shRaptor#1, A) or Rictor (shRictor#2, B). AU, arbitrary units. The cells were co-transfected with a GFP-coding vector for visualization. On DIV7, doxycycline was added, and cells were fixed on DIV10. Afterward, the cells were stained with antibody against endogenous Raptor or Rictor, and immunofluorescence intensity was quantified (A, pSUPERTRE, n = 86; shRaptor#1TRE, n = 69; B, pSUPERTRE, n = 35; shRictor#2TRE, n = 37). Cell images were obtained from three independent culture batches. Error bars indicate S.E. ***, p < 0.001; ns, not significant (Mann-Whitney test). C, shown is TNDT of in vitro-cultured hippocampal neurons co-transfected on DIV6 with a plasmid that encoded tTS and shRaptor#1TRE (n = 50), shRaptor#2TRE (n = 50), or pSUPERTRE (n = 50) treated with doxycycline on DIV7 and fixed either immediately or on DIV9. D, shown is TNDT of in vitro cultured hippocampal neurons co-transfected on DIV6 with a plasmid that encoded tTS and shRictor#1TRE (n = 50), shRictor#2TRE (n = 50), or pSuperTRE (n = 50) treated with doxycycline on DIV7 and fixed either immediately or on DIV9. E, shown are representative images of cells, the development of which was followed for 3 consecutive days after the induction with doxycycline of either Raptor or Rictor knockdown. F, the number of newly added dendrites on each consecutive day (pSUPERTRE, n = 43; shRaptor#1TRE, n = 34; shRictor#2TRE, n = 45) is shown. G, shown is the number of retracted dendrites on each consecutive imaging day (n as in F). H, shown is the sum of new additions and retractions during entire experiment. I, shown is net change of dendrite number for each consecutive imaging day (n as in F). Cell images were obtained from three culture batches. Error bars indicate S.E. ***, p < 0.001; ns, not significant (Mann-Whitney test). Scale bar = 20 μm.
FIGURE 5.
FIGURE 5.
Insulin induces dendritic growth in an mTORC1- and mTORC2-dependent manner. Shown are representative images (A) and analysis of TNDT (n = 60 for each experimental group) (B) of in vitro-cultured hippocampal neurons transfected on DIV8 with GFP and grown for 3 days under conditions of reduced B27 supplementation and in the presence or absence of 100 nm rapamycin. Insulin (400 nm) was added immediately after transfection and then after every 24 h. Shown are representative images (C), analysis of TNDT (n = 52 for each experimental group) (D), analysis of TDL (n as in D) (E), and Sholl analysis (n as in D) (F) of in vitro-cultured hippocampal neurons transfected on DIV8 with control pSUPER vector or pSUPER that encoded shRNA against Raptor (shRaptor#1, shRaptor#2) or Rictor (shRictor#1, shRictor#2) and grown for 3 days under conditions of reduced B27 supplementation. As an additional control, in one variant the cells were grown under normal B27 conditions. GFP was co-transfected to identify transfected cells and visualize neuronal morphology. Insulin (400 nm) was added immediately after transfection and then after every 24 h. Cell images were obtained from 3 culture batches. Error bars indicate S.E. ***, p < 0.001; **, p < 0.01; ns, not significant (Mann-Whitney test). Scale bar = 20 μm.
FIGURE 6.
FIGURE 6.
Raptor and Rictor knockdown inhibits dendritic growth induced by constitutively active PI3K, but only Rictor knockdown can be rescued by Akt activation. A–E, hippocampal neurons cultured in vitro were co-transfected on DIV8 for 5 days with either EFα-β-gal (control) or p110CAAX and control pSUPER vector or pSUPER that encoded shRNA against Raptor (shRaptor#1, shRaptor#2) or Rictor (shRictor#1, shRictor#2). Neuronal morphology was visualized by co-transfected GFP. Shown are representative images of neurons transfected as indicated A, TNDT (B), TDL (C), and Sholl analysis of hippocampal neurons (D and E) transfected as indicated. Error bars indicate S.E. ***, p < 0.001; *, p < 0.05; ns, non significant (Mann-Whitney test). Scale bar = 20 μm. F–J, hippocampal neurons cultured in vitro were co-transfected on DIV8 for 5 days with either EFα-β-gal (control) or myr-Akt and control pSUPER vector or pSUPER-shRaptor#1, pSUPER-shRaptor2, pSUPER-shRictor#1, or pSUPER-shRictor#2. Neuronal morphology was visualized by co-transfected GFP. F, representative images of neurons were transfected as indicated. TNDT (G), TDL (H), and Sholl analysis (I, J) of hippocampal neurons were transfected as indicated (B–J, pSUPER/β-gal, n = 31; shRaptor#1/β-gal, n = 36; shRaptor#2-gal, n = 30; shRictor#1/β-gal, n = 31; shRictor#2/β-gal, n = 31; pSUPER/p110CAAX, n = 31; shRaptor#1/p110CAAX, n = 36; shRaptor#2/p110CAAX, n = 25; shRictor#1/p110CAAX, n = 31; shRictor#2/p110CAAX, n = 31; pSUPER/myr-Akt, n = 32; shRaptor#1/myr-Akt, n = 35; shRaptor#2/myr-Akt, n = 33; shRictor#1/myr-Akt, n = 34; shRictor#2/myr-Akt, n = 32). Cell images were obtained from three independent culture batches. Error bars indicate S.E. ***, p < 0.001; ns, not significant (Mann-Whitney test). Scale bar = 20 μm.
FIGURE 7.
FIGURE 7.
Simultaneous knockdown of Raptor and Rictor alone or in combination with mTOR inhibitors had no fully additive phenotypic effects on dendritic arborization. Shown are representative images (A) and analysis of TNDT (n = 39 for each experimental group) (B), TDL (n as in B) (C), and Sholl analysis (n as in B) (D–F) of in vitro-cultured hippocampal neurons transfected on DIV8 for 3 days with control pSUPER vector or pSUPER that encoded shRNA against Raptor (shRaptor#1) or Rictor (shRictor#2) or Raptor and Rictor (shRaptor#1, shRictor#2). Cells were grown in the absence or presence of 100 nm rapamycin (R) or 300 nm Ku-0063794 (K). Cell images were obtained from three culture batches. Error bars indicate S.E. ***, p < 0.001 (Mann-Whitney test). Scale bar = 20 μm. Please note that the results presented on D–F come from the same three independent experiments but have been split for three graphs for the clarity and convenience of data presentation.
FIGURE 8.
FIGURE 8.
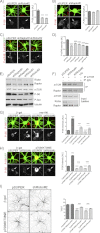
Rictor knockdown effects can be reversed by activation of Akt and p70S6K. A and B, hippocampal neurons cultured in vitro were transfected on DIV8 for 3 days with either control pSUPER vector or pSUPER that encoded shRNA against Raptor (shRaptor#1, shRaptor#2) or Rictor (shRictor#1, shRictor#2). The cells were co-transfected with a GFP-coding vector for visualization. A, neurons transfected with shRNAs against Rictor were stained for P-S6 (Ser-235/Ser-236) (pSUPER, n = 63; shRictor#1, n = 53; shRictor#2, n = 58) (B), whereas those transfected with shRaptor were checked for P-Akt (Ser-473) (pSUPER, n = 53; shRictor#1, n = 41; shRictor#2, n = 44). C and D, hippocampal neurons cultured in vitro were transfected on DIV8 for 3 days with either control pSUPER vector or pSUPER that encoded shRNA against Raptor (shRaptor#1, shRaptor#2) or Rictor (shRictor#1, shRictor#2). Cells were additionally transfected with a GFP-coding vector for visualization. As an additional control, in one variant cells were grown in the presence of 100 nm rapamycin (R). Afterward, the cells were stained with antibody against P-eIF4B (Ser-422), and the average intensity of immunostaining of the cell soma of transfected cells was measured (pSUPER, n = 59; shRaptor#1, n = 55; shRaptor#2, n = 60; shRictor#1, n = 60; shRictor#2, n = 62, pSUPER+R, n = 61) (D). Cell images were obtained from three culture batches. Scale bar = 20 μm. E and F, cortical neurons at DIV0 were nucleofected with pSUPER vector or pSUPER that encoded shRNA against Raptor (shRaptor#1, shRaptor#2) or Rictor (shRictor#1, shRictor#2) for 10 days. Next, the levels of indicated proteins in cell lysates were analyzed (E), or immunoprecipitation of mTOR was performed (F). Data from one of three experiments are presented. G, hippocampal neurons cultured in vitro were transfected on DIV8 for 3 days with either EFα-β-gal (control) or myr-Akt and control pSUPER vector or pSUPER that encoded shRNA against Rictor (shRictor#1, shRictor#2). The cells were co-transfected with a GFP-coding vector for visualization. Cells were stained for P-S6 (Ser-235/S236), and average intensity of cell body immunostaining was measured (pSUPER/β-gal, n = 60; shRictor#1/β-gal, n = 57; shRictor#2/β-gal, n = 60; n = 31; pSUPER/myr-Akt, n = 59; shRictor#1/myr-Akt, n = 59; shRictor#2/myr-Akt, n = 59). H, hippocampal neurons cultured in vitro were transfected on DIV8 for 3 days with either EFα-β-gal (control) or p70S6KT389E and control pSUPER vector or pSUPER that encoded shRNA against Rictor (shRictor#1, shRictor#2). The cells were co-transfected with a GFP-coding vector for visualization. Cells were stained for P-S6 (Ser-235/Ser-236), and average intensity of cell body immunostaining was measured (pSUPER/β-gal, n = 62; shRictor#1/β-gal, n = 58; shRictor#2/β-gal, n = 59; pSUPER/p70S6KT389E, n = 62; shRictor#1/p70S6KT389E, n = 62; shRictor#2/p70S6KT389E, n = 60). Scale bar = 10 μm. I, shown are representative images of neurons transfected as indicated and TNDT (n as in H). Cell images were obtained from three independent culture batches. Error bars indicate S.E. ***, p < 0.001 (Mann-Whitney test). Scale bar = 20 μm.

References

    1. Stuart G., Spruston N., Häusser M. (2007) Dendrites, 2nd Ed., Oxford University Press, Oxford
    1. Jan Y. N., Jan L. Y. (2010) Branching out. Mechanisms of dendritic arborization. Nat. Rev. Neurosci. 11, 316–328 - PMC - PubMed
    1. Urbanska M., Blazejczyk M., Jaworski J. (2008) Molecular basis of dendritic arborization. Acta Neurobiol. Exp. (Wars) 68, 264–288 - PubMed
    1. Chow D. K., Groszer M., Pribadi M., Machniki M., Carmichael S. T., Liu X., Trachtenberg J. T. (2009) Laminar and compartmental regulation of dendritic growth in mature cortex. Nat. Neurosci. 12, 116–118 - PMC - PubMed
    1. Jaworski J., Spangler S., Seeburg D. P., Hoogenraad C. C., Sheng M. (2005) Control of dendritic arborization by thephosphoinositide-3'-kinase-Akt-mammalian target of rapamycin pathway. J. Neurosci. 25, 11300–11312 - PMC - PubMed

Publication types

MeSH terms

Substances